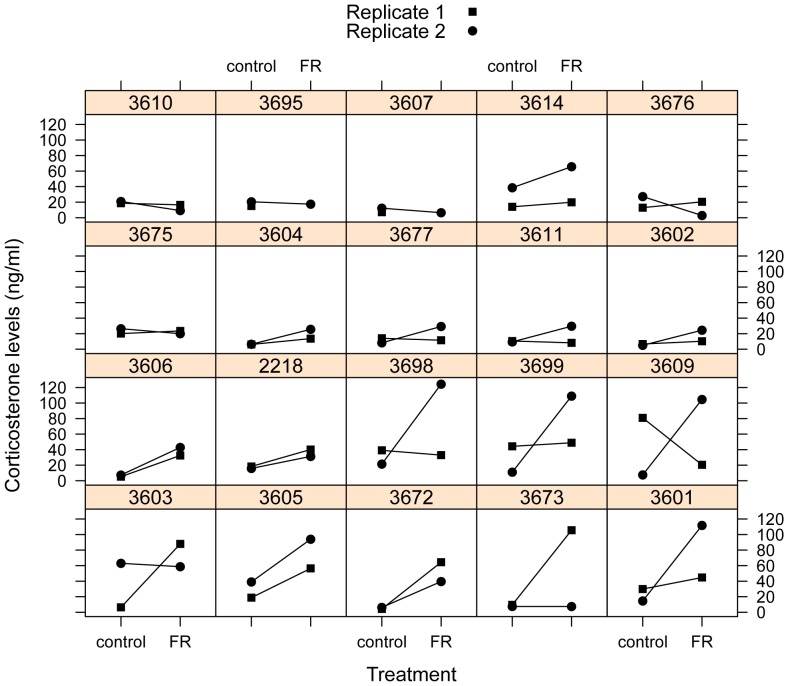
Figure 3. Corticosterone levels in response to a dietary treatment in house sparrows.
The treatment was either control or food restricted (‘FR’), which corresponded to 110% or 60% respectively of daily food intake for each individuals. Each individual (denoted here by their band numbers above each box) received both treatments twice during the course of the study. Replicate 1 or 2 refers to the weeks (1–2 and 4–5 respectively) when they received the treatments. One blood sample was missed for two individuals (3607, 3695 in the top row). Individuals are ordered by degree of plasticity (after controlling for changes in their body mass), as in Fig.4.

