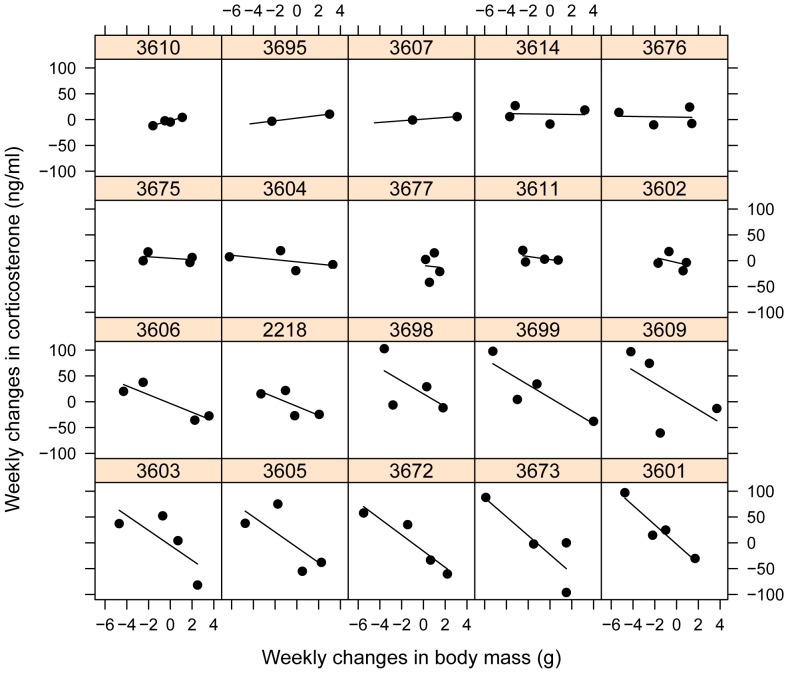
Figure 5. Relationship between the weekly changes in body mass and corticosterone levels in individual house sparrows.
Individuals are denoted by their band number above each box. Panels are ordered in function of the individuals' conditional responsiveness (i.e., the slope of the fitted line), from left to right starting with the top row.

