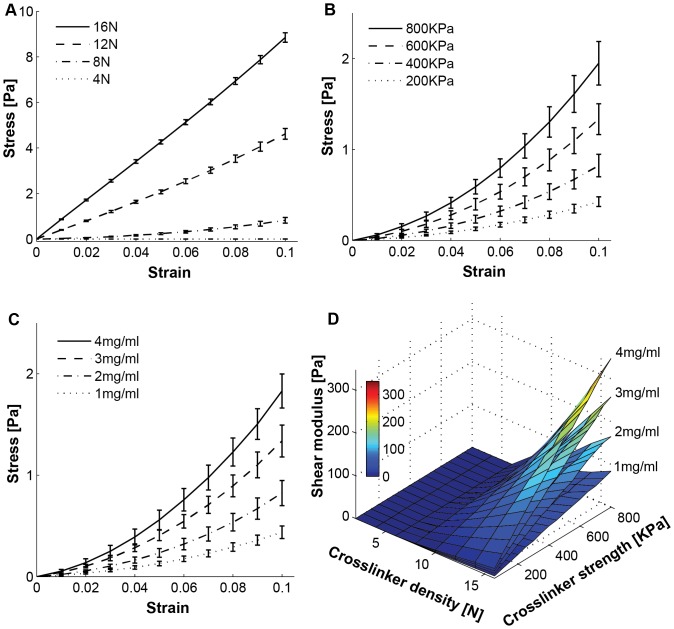
Figure 3. Shear simulation results.
We simulated 8 different crosslinker densities (2, 4, …, 16N, 2N increment), 16 different crosslinker strengths (50, 100, …, 800 KPa, 50 KPa increment), and 4 different collagen densities (1, 2, 3, 4 mg/ml) for random fiber networks, which is total 512 different parameter sets. Shear stress - shear strain curves for ten strains using a 0.01 strain step size are shown in various crosslinker densities with fixed 400 KPa crosslinker strength (A) of 2 mg/ml collagen density case, various crosslinker strengths with fixed 8N crosslinker density (B) of 2 mg/ml collagen density case, and various collagen densities with fixed 400 KPa crosslinker strength and fixed 8N crosslinker density (C). Five independent runs were conducted for each parameter set. Only four curves for each varied parameter are shown for the better visualization. (D) Shear modulus surface plot for four different collagen densities, 8 different crosslinker densities and 16 different crosslinker strength. Each modulus value was calculated from the regression line slope of the stress-strain curve.

