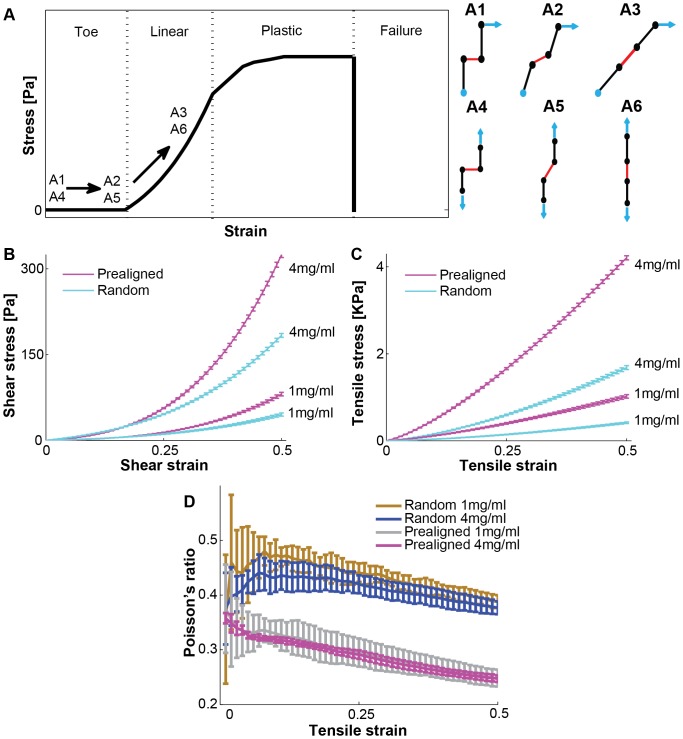
Figure 6. Stress-strain curves from small strain toe region to medium strain linear region.
(A) Schematic stress-strain curve to illustrate toe, linear, plastic, and failure region. A collagen fiber network is soft at the small deformation state, but stiff at the large deformation state because realigning fibers through crosslinkers play a pivotal role in the strain stiffening. Realignment illustration of fiber network model for shear test (A1: zero strain, A2: small strain, A3: medium strain) and tensile test (A4: zero strain, A5: small strain, A6: medium strain). Black solid lines represent collagen fibers and red solid lines are crosslinkers. Black dots represent beads which can have elastic connection with other beads. Light blue solid arrows represent force vectors, and a light blue dot represents anchored fixed beads for shear test. Simulated stress-strain curves of shear test (B) and tensile test (C) for two different collagen densities: 1, 4 mg/ml and two different network geometries: prealigned network and random network using the best-fit crosslinker parameter values. The errorbars are standard deviation from the mean in 5 independent simulations. We simulated up to 0.5 strain with a 0.01 strain step size. (D) Poisson's ratio of tensile tests in (C) for both random and prealigned networks.

