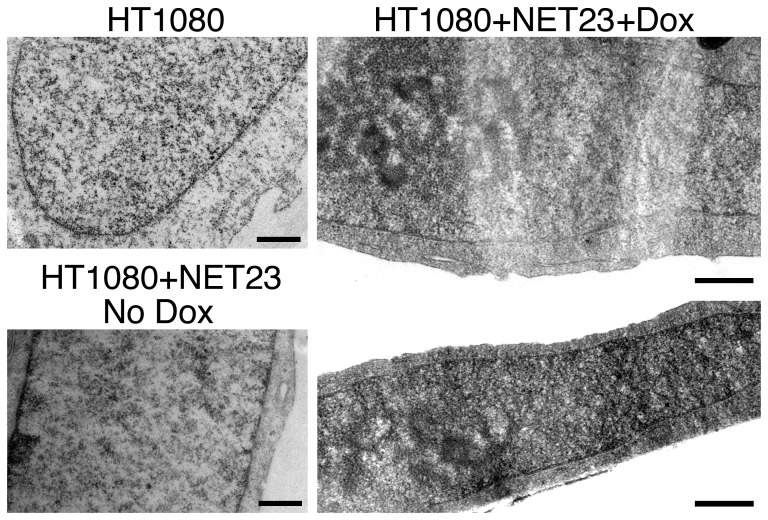
Figure 4. Chromatin compaction in NET23/STING overexpressing cells as visualized by electron microscopy.
Panels on the right are for the HT1080 parent cell line and its uninduced progeny (HT1080+NET23 No Dox) carrying the integrated NET23/STING construct. Panels on the left are cells induced with doxycycline for NET23/STING expression for overnight prior to fixation for electron microscopy. Scale bars are 0.5 µm.

