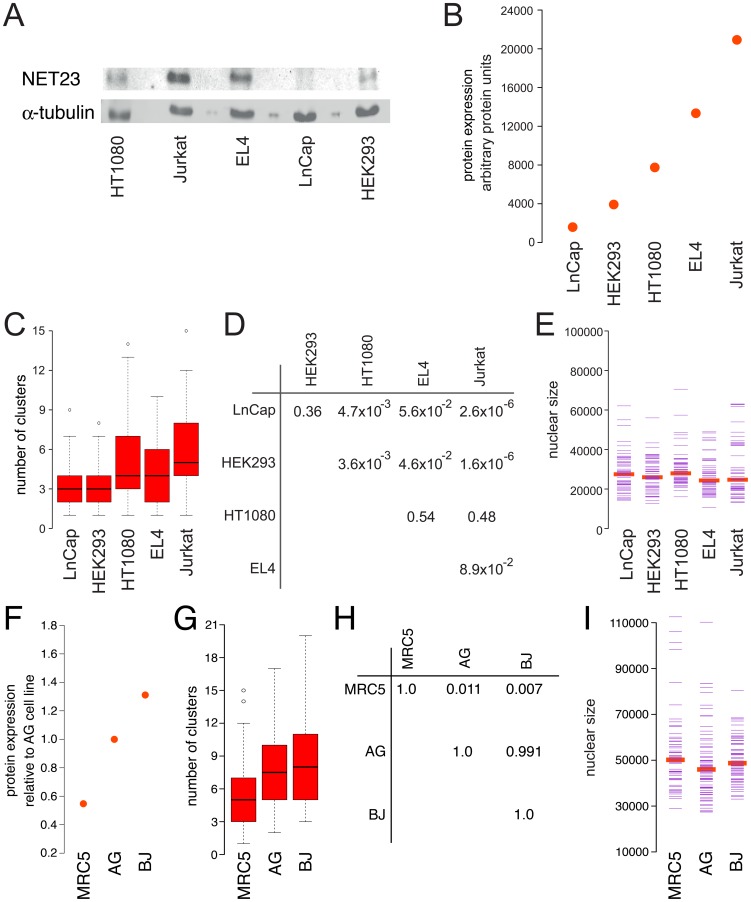
Figure 5. Endogenous NET23/STING expression correlates with levels of normal chromatin compaction observed in various cell types.
(A–E) Transformed cell lines. (A) Western blot comparing levels of NET23/STING in different cell lines with α-tubulin used as a loading control. (B) Quantification of NET23/STING levels from three separate Western blots. The endogenous levels of NET23/STING have been corrected for α-tubulin levels and ordered from lowest to highest. (C) Using the algorithm described in Figure 3 to determine endogenous levels of chromatin compaction in the same cell lines, similarly ordered, reveals a general trend that cells with higher endogenous levels of NET23/STING have higher levels of chromatin compaction. (D) Table showing p-values for C, comparing all possible combinations using KS tests. (E) Nuclear size was also tested for each cell line, finding no notable differences. All p-values for nuclear size using KS tests were>0.05 with the exception of comparing HT1080 and EL-4 cells (p = 0.039) and HT1080 and Jurkat cells (p = 0.003). (F–I) Primary cell lines. (F) Basal NET23/STING protein levels for three primary cell lines relative to the AG line. (G) Cluster algorithm to determine endogenous levels of chromatin compaction based on DAPI staining. (H) P values for comparing cluster number between the different cell lines using KS tests comparing each to the others. (I) Nuclear size measured for the three primary lines to ensure that all were similar so that this parameter could not influence cluster number results.

