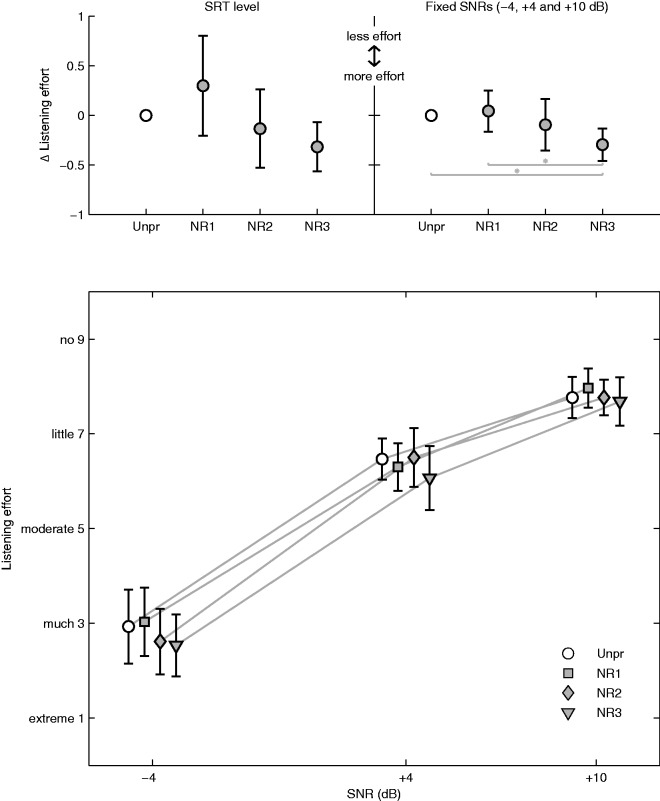
Figure 4.
Mean and 95% confidence interval of the listening effort ratings assigned by the 20 subjects relative to unprocessed (Δ listening effort, upper panel) at SRT level (left) and averaged over the three fixed SNRs (right), and absolute ratings at −4, +4, and +10 dB SNR (lower panel). Horizontal lines indicate which processing conditions differ significantly from each other (*p < .05/6 = .0083; Bonferroni-corrected threshold for six comparisons).

