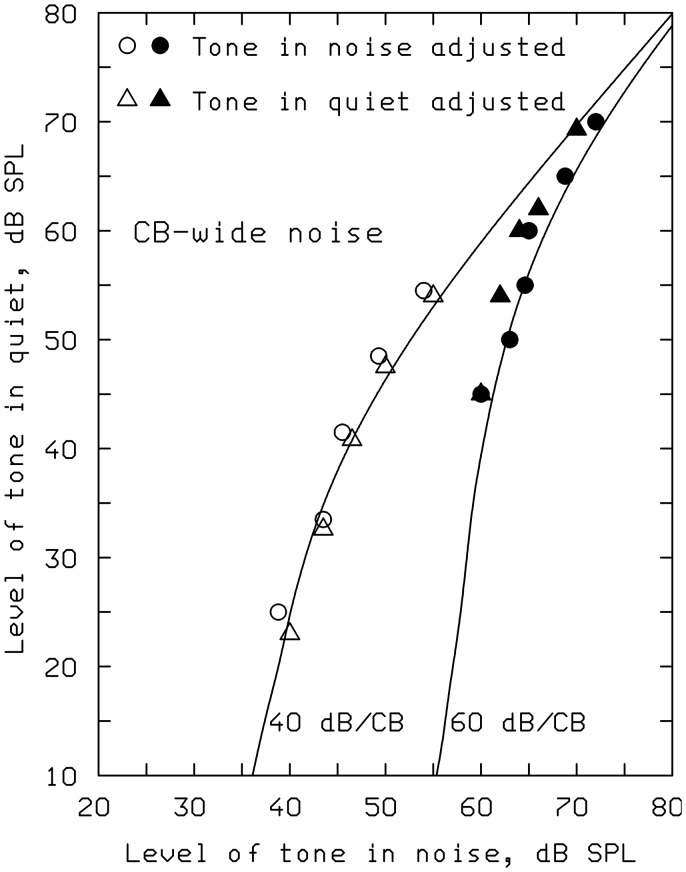
Figure 10.
Comparison of predictions of the 1997 model with data of Zwicker (1963).
Note. Symbols show the level of a 1000-Hz tone in quiet required to match the loudness of a 1000-Hz tone in a one-critical-band-wide noise centered at 1000 Hz. The noise level was 40 dB SPL (open symbols) or 60 dB SPL (solid symbols) dB SPL. Curves show predictions of the 1997 model.

