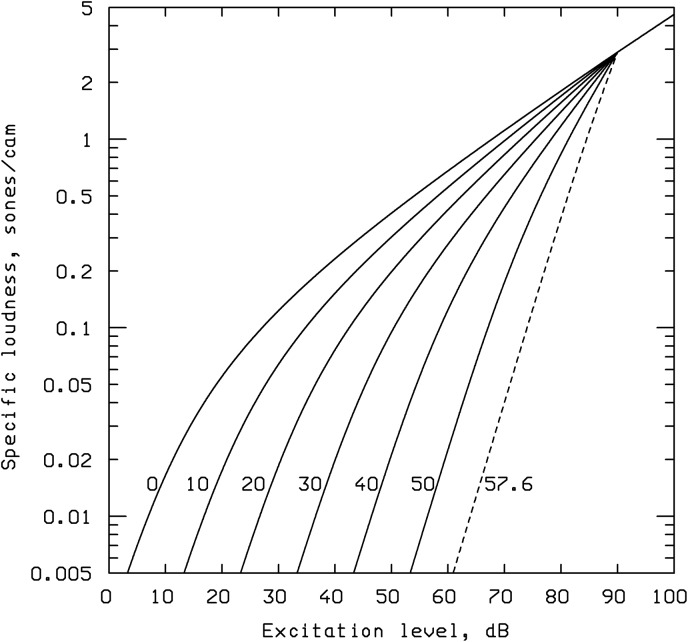
Figure 17.
Functions relating specific loudness to excitation level, with the excitation level at absolute threshold as parameter.
Note. The number next to each curve is the excitation level required for absolute threshold plotted relative to the value for normal hearing for frequencies above 500 Hz.

