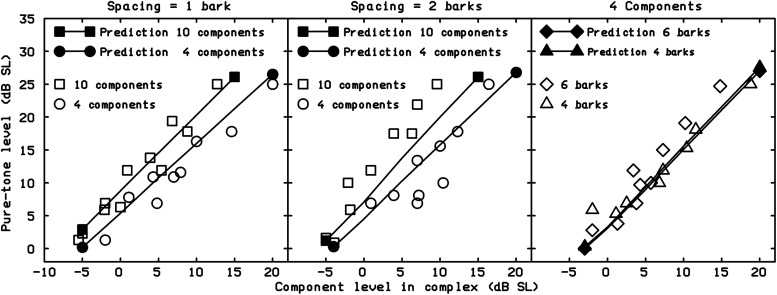
Figure 19.
Comparison of results obtained by Buus and Florentine (2002) and the predictions of the 2004HI model (lines).
Note. For the left and middle panels, the component spacing in the complex sounds was fixed at one or two barks and the number of components was either 4 or 10. For the right panel, there were four components, and the component spacing was four or six barks. See text for details.

