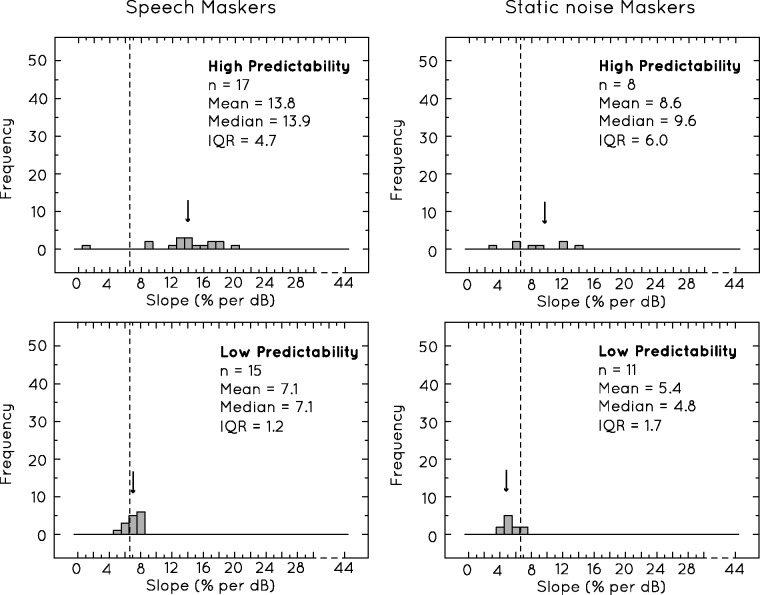
Figure 5.
The different distributions of slope values found when there was either a high or low probability of target speech being predicted from previous context. The left panels plot these distributions for speech maskers, while the right panels plot these distributions for static noise maskers. The dotted lines indicate the overall median slope value for the survey, while the arrows indicate the median slope value for each specific distribution. Only cases where one masker was used are included.

