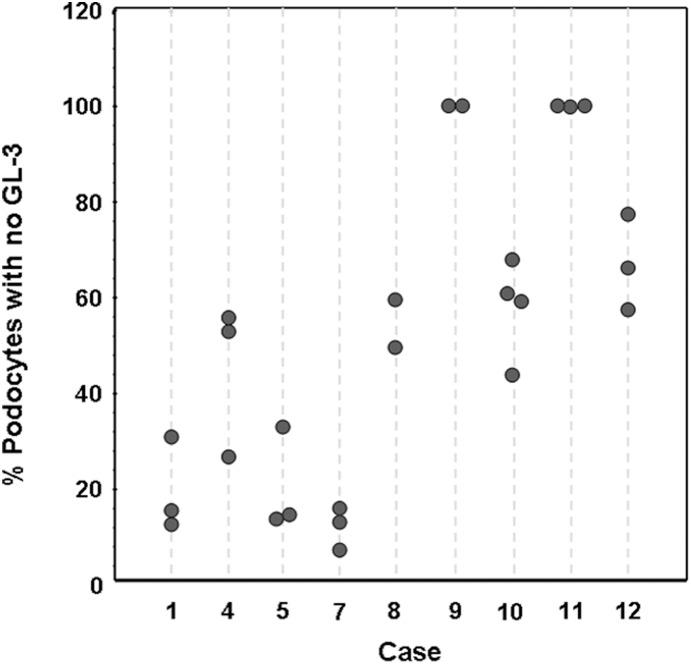
Figure 2. Intra- and inter-subject variability of podocyte mosaicism for Fabry phenotype in females.
X axis shows case numbers (see Table 1). Each vertical dashed line represents a biopsy and each circle represents % podocytes with no GL-3 inclusions in one glomerulus.

