
Figure 2. The production of amorphadiene in the wild type WAT11 strain and single mutants.
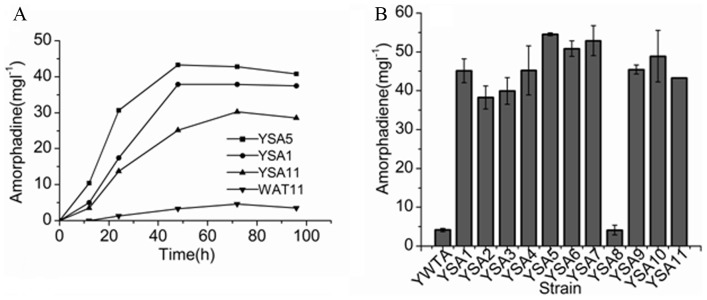
(A) The accumulation pattern of amorphadiene by the wild type WAT11 strain and the three single mutants (YS1,YS5, YS11) at 12, 24, 48, 72 and 96 h after the induction; (B) The production of amorphadiene by each single mutant compared to the wild type WAT11 strain at the 72 h post-induction. The level of amorphadiene at the initiation point was set as zero, and the levels at other time points were normalized thereto.