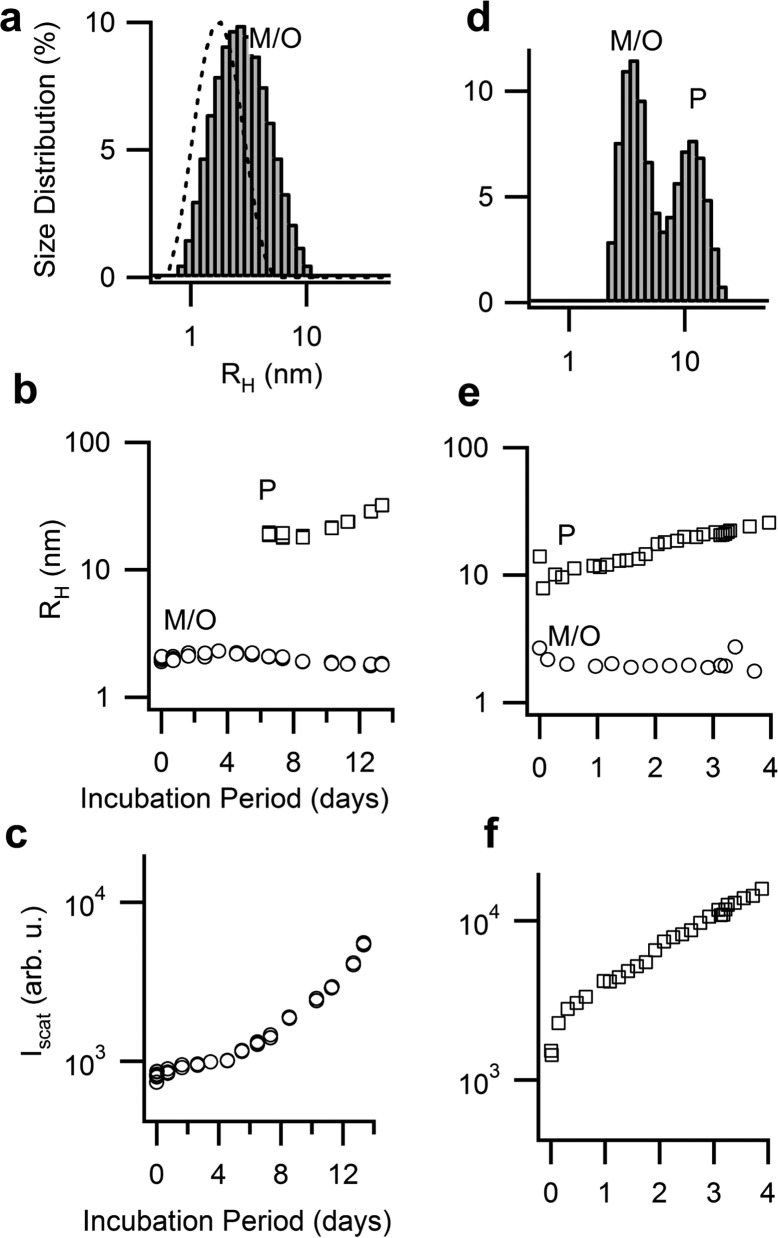
Figure 3.
Seeding native lysozyme with oligomers and protofibrils at pH 7. Particle size distribution derived from DLS for solutions of lysozyme monomers at pH 7 seeded with 20% (v/v) of (a) oligomers or (d) mixtures of oligomers and protofibrils. Labels indicate the (merged) monomer/oligomer peak (M/O) and protofibril peak (P). The dashed curve in (a) shows the distribution for monomers alone. Temporal evolution in the peak radii for samples seeded with (b) oligomer-seeded or (c) oligomer and protofibril. Corresponding changes in scattering intensity are displayed in panels (c) and (f). The sample seeded with oligomers nucleated protofibrils around 6 days (see panel b).

