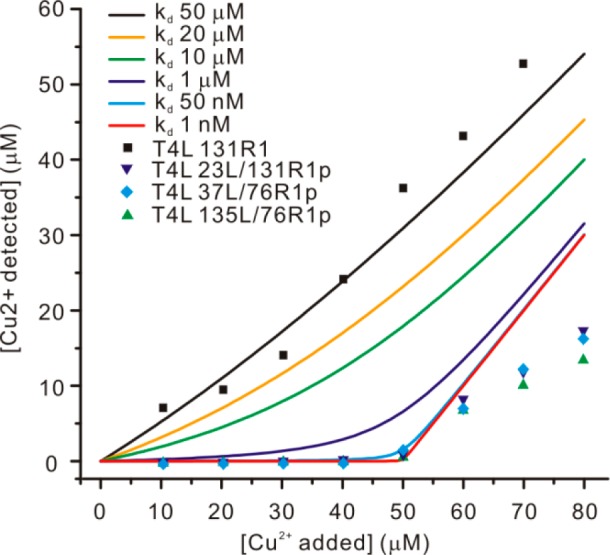
Figure 3.

Summary of the Cu2+ titration study. The equilibrium free Cu2+ concentration is plotted as a function of total added Cu2+. Theoretical titration curves using different Kd values are color-coded as listed in the inset. Experimental titration data from four samples, including a control sample, are also listed in the inset. In all titration studies, the concentration of protein was maintained at 50 μM.
