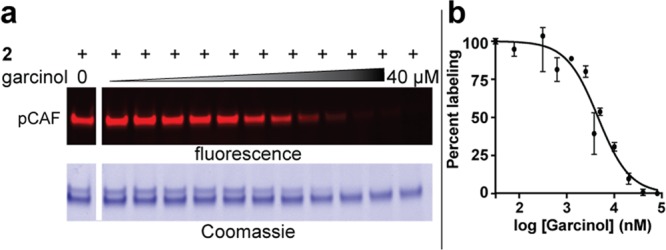
Figure 4.

Competitive profiling of KAT active-site occupancy. (a) Fluorescent and Coomassie gels from pCAF-garcinol competition experiment. Conditions: 2 (1 μM), garcinol (0, 0.08, 0.16, 0.33, 0.63, 1.26, 2.5, 3.75, 5, 10, 20, 40 μM). (b) Dose-response analysis of competitive labeling generated via gel densitometry analysis of fluorescent labeling by KAT probe 2.
