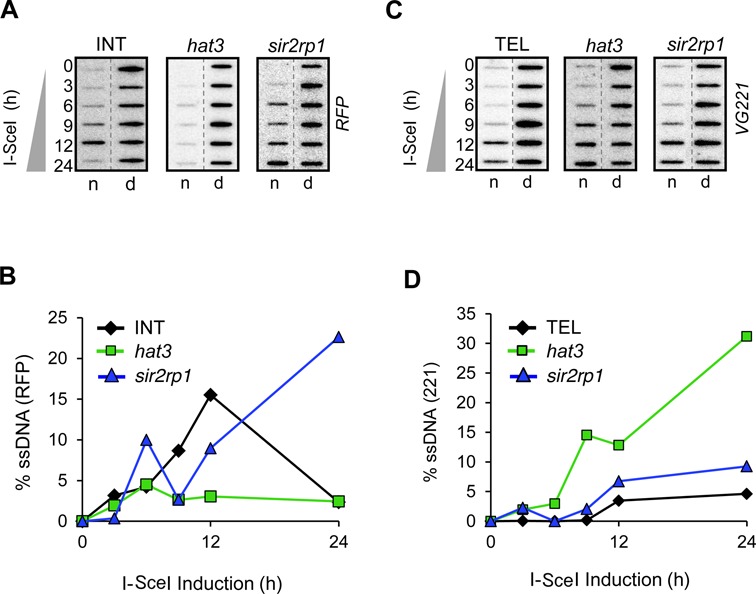
Figure 5.

Locus-dependent control of DNA resection by HAT3. Accumulation of ssDNA adjacent to a DSB was monitored by slot-blot analysis in the INT (A) and TEL (C) strains. Genomic DNA was extracted at the times indicated following I-SceI induction. Ninety percent of each sample was ‘native’ (n; where a hybridization signal with native DNA indicates the presence of ssDNA) and the remainder was denatured (d). The probes used on each blot are indicated on the right (see the schematic maps in Figures 1A and 4A). ssDNA signals from the INT (B) and TEL (D) strains were quantified by phosphorimager analysis as previously described (10).
