
Figure 4.
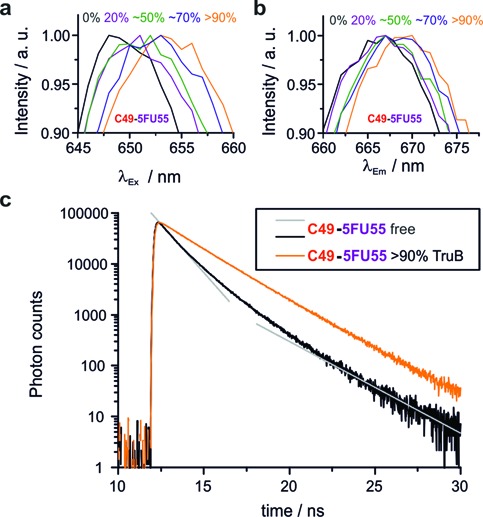
Protein binding (∼% binding is given) causes bathochromic shifts of excitation (a, λEm = 668 nm) and emission spectra (b, λEx = 647 nm). Fluorescence decay curves (c) differ in absence of TruB and with >90% TruB binding. Gray straight lines indicate bi-exponential fast decay (absence of TruB). The bi-exponential slow decay for >90% TruB binding appears to be mono-exponential due to the log-scale of the y-axis.