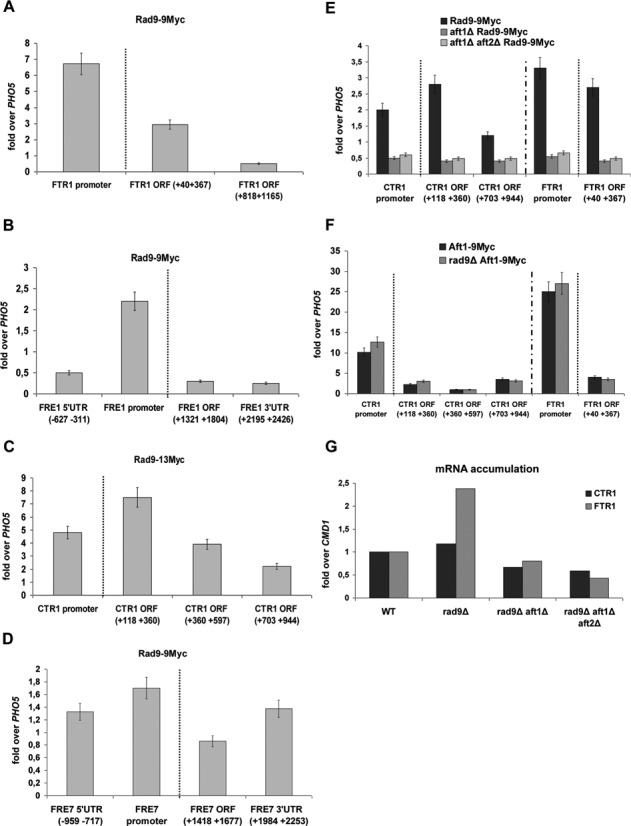
Figure 2.

Rad9 is recruited to Aft1-regulated genes in an Aft1-dependent manner. By ChIP analysis the enrichment of Rad9–9Myc was studied in each amplicon (x-axis): on FTR1(A), on FRE1(B), on CTR1(C) and on FRE7 gene (D). The enrichment of Rad9–9Myc on CTR1 and FTR1 promoter and coding regions as obtained by ChIP analyses in Rad9–9Myc, aft1Δ Rad9–9Myc and aft1Δaft2Δ Rad9–9Myc strains is visualized in (E). Aft2 is an Aft1 paralogue protein, with partially redundant function (40,41). The Aft1–9Myc enrichment on CTR1 and FTR1 promoter and coding regions as obtained by ChIP analyses in Aft1–9Myc and rad9Δ Aft1–9Myc is visualized in (F). All strains were grown under induction conditions (see text). Normalization in all cases was performed firstly over INPUT chromatin and secondly by measuring the enrichment of Rad9–9Myc on PHO5 coding region, where Rad9–9Myc binding is minimal in such growth conditions (as tested by our group) and dividing Rad9–9Myc enrichment to this ‘non-specific’ enrichment. A dotted line in the ChIP experiments distinguishes the enrichment in the gene promoter from the enrichment in the coding regions. (G) RNA was isolated from strains (x-axis) grown under induction conditions and RT assay combined with qPCR was performed, aiming to assess changes in the CTR1 and FTR1 transcript levels. Normalization was done over change of CMD1 expression (not altered in these growth conditions), after firstly normalizing over the wt strain. The experiment was performed three times.
