Figure 5.

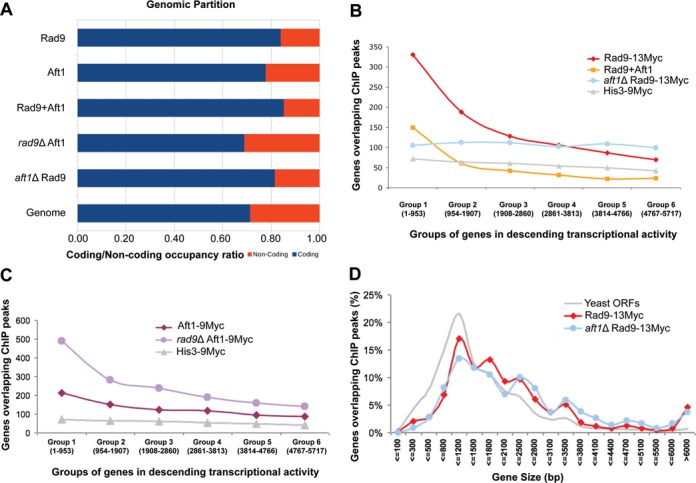
Genome-wide localization of Rad9 in the presence and absence of Aft1. (A) Partition of ChiP peaks into coding and non-coding chromatin for: Rad9–13Myc, Aft1–9Myc, common sites, rad9Δ Aft1–9Myc and aft1Δ Rad9–13Myc compared to the background partition for the complete yeast genome. A clear enrichment in coding sequences is especially notable for the common sites (Rad9–13Myc+Aft1–9Myc). All coding ratios except of rad9Δ Aft1–9Myc have a value of 0.79 or more compared to a genome average of 0.71. Bootstrap P-values of enrichment were calculated using 106 random permutations of the binding sites. All P-values were <10−6 except from rad9Δ Aft1–9Myc which showed a partition similar to the genome background. (B) Rad9–13Myc is localized to the most active yeast genes in an Aft1-dependent manner. Yeast genes were grouped in six equal groups (x-axis) in descending transcriptional activity in SC BCS BPS growth conditions (our microarray data). Rad9 targets (ChIP peaks significant to a P < 0.005 level) that fell within each group were calculated (y-axis) in wt or aft1Δ cells (red and blue lines, respectively). Distribution of common targets of Rad9 and Aft1 is also shown. His3–9Myc control protein is shown in grey. (C) The same analysis as in (B) was performed for Aft1–9Myc in wt or rad9Δ cells (dark and light purple lines, respectively) following curves with similar slopes. (D) Rad9–13Myc has a binding bias for long genes. S. cerevisiae genes were grouped in 20 bins depending on their size (x-axis). The percentage of the number of ChIP peaks from each experiment that fit each of the bins is plotted. The distribution of all yeast Open Reading Frames (ORFs) is plotted in grey line.
