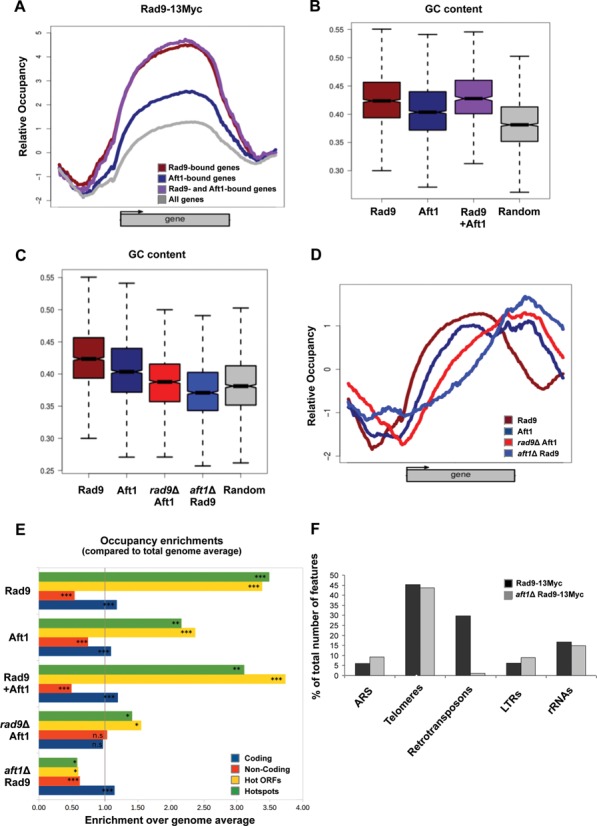
Figure 7.

Rad9 localizes to GC-rich regions and meiotic recombination hotspots in an Aft1-dependent manner. (A) Rad9–13Myc ChIP signal mean patterns for genes bound by Rad9, Aft1 and by both proteins compared to the average for the total number of yeast genes. (B) GC content boxplots of genes bound by Rad9, Aft1 or both proteins in comparison to the complete set of genes in full correspondence with (A). Rad9-bound genes show the highest GC content. (C) GC content boxplots of binding sites (enriched loci) for Rad9 and Aft1, in the presence or absence of each other, compared to a set of randomly selected genomic positions. Rad9 sites also show the highest GC content, which is significantly lowered in the absence of Aft1. The same effect is observed for Aft1 in the absence of Rad9. (D) Mean binding patterns for Rad9 and Aft1 both in the presence and absence of each other (combined plot of Figure 6A–D). (E) Occupancy enrichment values for coding regions, non-coding spacers (see Figure 5A), hot ORFs and hotspots, expressed as the ratio of observed over expected occupancy based on the genome average. Significant (more than 2-fold) enrichment in Rad9, Aft1 and common binding sites was observed for both hot ORFs and hotspots while significant depletion was calculated for Rad9 sites in the absence of Aft1 and to a lesser extent for Aft1 sites in the absence of Rad9. Bootstrap values calculated for 106 random permutations. (***P < 10−6; **P < 10−4; *P < 10−3, n.s.=non-significant). (F) The five non-ORF feature categories that were most represented in Rad9–13Myc Tiling Arrays in the presence or absence of Aft1 (black and grey columns, respectively) are presented in the chart, as percentage of the total number of features in each category in the yeast genome.
