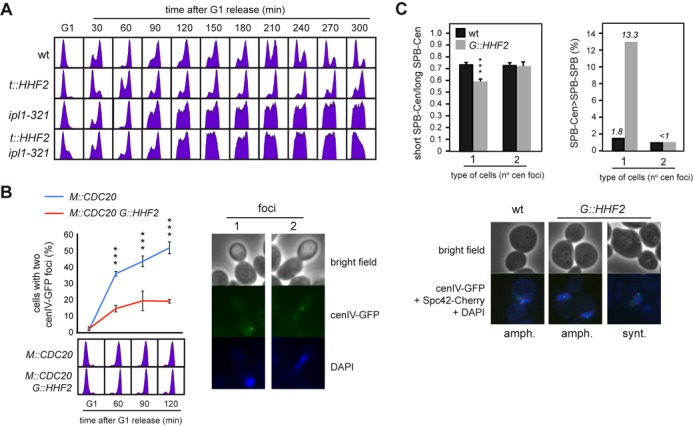
Figure 3.

SAC activation by histone depletion requires Ipl1/Aurora kinase and is associated with defective centromere biorientation. (A) Ipl1/Aurora kinase is required for SAC activation by histone depletion. DNA content analysis by flow cytometry of wild-type, ipl1-321, t::HHF2 and t::HHF2 ipl1-321 cells synchronized in G1 at permissive temperature (26°C) and released into fresh medium at semi-permissive temperature (34°C) under conditions of histone depletion. (B) Histone depletion impairs chromosome biorientation. Chromosome biorientation was determined by fluorescence microscopy based on the accumulation of metaphase M::CDC20 and M::CDC20 G::HHF2 cells with two cenIV-GFP foci. For this, cultures were synchronized in G1 and released under conditions of histone depletion into fresh medium containing 8 mM methionine, which switches off the MET3 promoter and arrests cells in metaphase through Cdc20 depletion. The DNA content profile for each sample is shown at the bottom. A total number of 100 cells were analyzed for each time point. The average and SEM of three independent experiments are shown. Three asterisks indicate a statistically significant difference according to a two-way Anova test (P-value <0.001). (C) Histone depletion alters the symmetry of the centromere relative to the SPBs in cells with a single cenIV-GFP dot but not in cells with two cenIV-GFP dots. This symmetry was determined as the ratio between the short and long distances from the centromere (detected as a cenIV-GFP dot) to each SPB (detected as two Spc42-Cherry dots) (left), and the frequency of cells in which the longest SPB-centromere distance is higher than the SPB–SPB distance (right). Three asterisks indicate a statistically significant difference according to a one-way Anova test (P-value <0.001). The analysis was performed in M::CDC20 and M::CDC20 G::HHF2 cells synchronized in G1 and released into fresh medium for 120 min following the growth conditions indicated in (B). A total number of 250 cells for each strain from two independent experiments were analyzed. Representative images for (B) and (C) are shown.
