Figure 2.

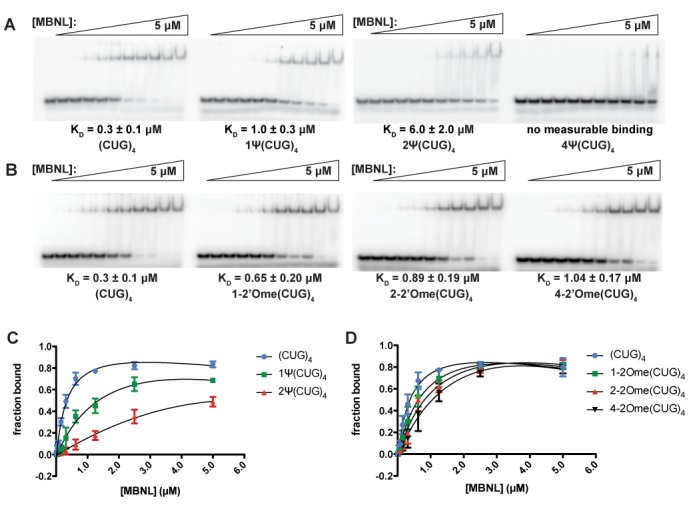
Binding gels and curves for MBNL1-(CUG)4 RNA interactions. (A) Binding gels from MBNL1-(CUG)4 affinity assays for RNAs modified with Ψ. RNAs were radiolabeled with α-P32 and combined with different concentrations of a consensus MBNL1 sequence (amino acids 2–260). RNA–protein complex formation induces a band-shift due to an increase in size. KDs were calculated based on the signal from the radiolabeled RNA and values are approximately the [MBNL1] when 50% of the RNA is bound. (B) Binding gels from MBNL1-(CUG)4 affinity assays for RNAs modified with 2-’O-methylation. (C) Binding curves for (CUG)4 RNAs modified with Ψ. Data were fit to the following equation to determine KD values: fbound = fmax([MBNL1]/([MBNL1 + KD)). (D) Binding curves for (CUG)4 RNAs modified with 2′-O-methylation. KD values were calculated using the above equation.
