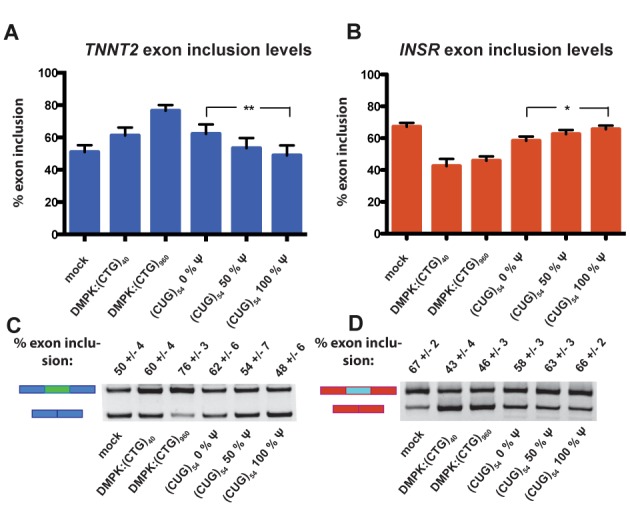
Figure 4.

CUG repeats with increasing levels of Ψ are unable to induce mis-splicing of MBNL1-regulated targets TNNT2 and INSR. (A) TNNT2 exon inclusion levels from a HeLa cell-splicing assay. The sample labeled mock represents percent exon inclusion when the reporter construct is transfected. The samples labeled DMPK:(CTG)40 and DMPK:(CTG)960 have the% exon inclusion when TNNT2 reporter as well as a plasmid containing the DMPK 3′UTR with 40 and 960 CTG repeats were transfected. The next three samples are the exon inclusion levels when the reporter along with in vitro-transcribed CUG repeats with increasing levels of Ψ were transfected. The difference in exon inclusion between the 0% Ψ samples and the 100% Ψ samples was statistically significant via a student's t test with a P = 0.0021 (** indicates that P ≤ 0.01). (B) INSR exon inclusion levels from a HeLa cell-splicing assay. These assays were set up following the same experimental theme described above, using an INSR reporter minigene instead of TNNT2. P = 0.0239 (* indicates that P ≤ 0.05). (C) A representative gel from the TNNT2 HeLa cell-splicing assay. Upper bands represent spliced transcripts with exons included and lower bands represent spliced transcripts with exons excluded. Quantification of these bands was used to obtain percent exon inclusion. (D) A representative gel from the INSR HeLa cell-splicing assay.
