
Figure 1.
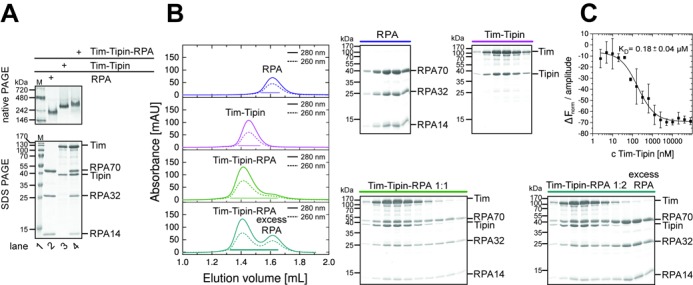
Tim-Tipin-RPA forms a 1:1:1 complex. (A) Native PAGE analysis reveals a homogeneous RPA (lane 2), Tim-Tipin (lane 3) and Tim-Tipin-RPA complex (lane 4). The assembly of the protein complexes was analyzed on Coomassie stained native gels (top) and by SDS-PAGE (bottom). M, molecular weight marker in kDa (lane 1). (B) SEC shows 1:1:1 complex formation of Tim-Tipin and RPA. Trimeric RPA and dimeric Tim-Tipin complexes ran as a single peak in SEC (blue and magenta). The 1:1 molar ratio mixture of RPA and Tim-Tipin eluted essentially as a single peak and shifted to higher molecular weight (green). Adding RPA at one molar excess to Tim-Tipin, showed an additional peak with the excess of RPA (cyan). The elution profile was visualized by UV absorbance at 280 nm (solid) and 260 nm (dashed). Peak fractions are indicated with lines and the corresponding Coomassie stained SDS-gels are shown (right). (C) MST titration of RPA with Tim-Tipin shows a KD of 0.18 μM.