
Figure 2.
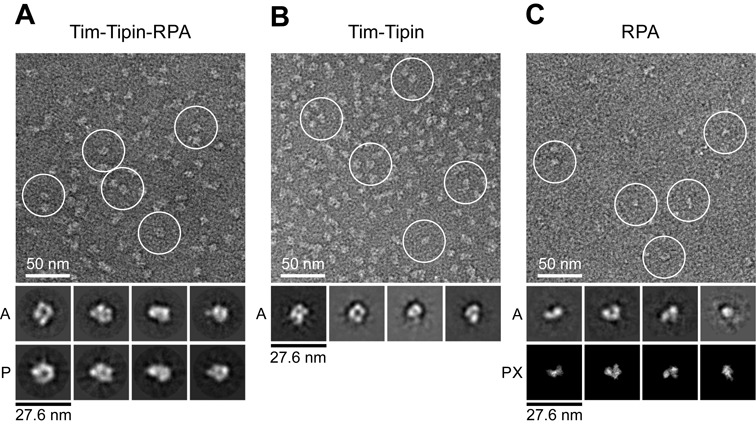
EM analysis of Tim-Tipin-RPA, Tim-Tipin and RPA. (A) Negative stain image of cross-linked Tim-Tipin-RPA (top). Examples of Tim-Tipin-RPA complex are marked with white circles. A, representative 2D class averages; P, reprojections of the 3D reconstruction. (B) Negative stain image of cross-linked Tim-Tipin. The image indicates that the main feature of the Tim-Tipin-RPA complex (Figure 2A) is given by Tim-Tipin. A, examples of 2D class averages. (C) Negative stain image of cross-linked RPA, showing a rod and horse shoe-shape structure of RPA. 2D class averages of RPA (marked with ‘A’) show comparable features to projections of the crystal structure of RPA bound to 32 nt ssDNA (PDB 4GNX) (marked with ‘PX’) (20).