
Figure 3.
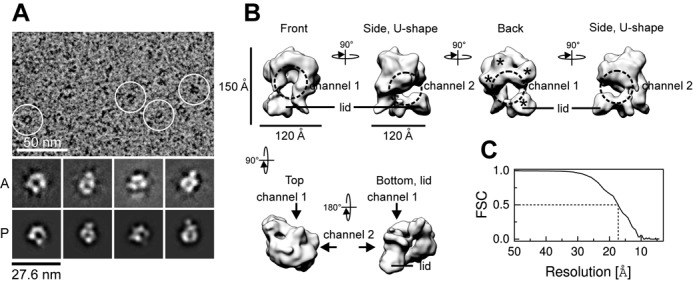
Cryo-EM analysis of the Tim-Tipin-RPA complex. (A) Representative image of vitrified Tim-Tipin-RPA complex. Examples of individual particles are circled in white. A, representative 2D class averages. P, projections of the 3D reconstruction. (B) Cryo-EM reconstruction of the Tim-Tipin-RPA complex using the negative stain 3D model (Supplementary Figure S5B) as initial reference and showing different views. The models are related by rotation around the y- and x-axis as indicated. The major density in the reconstruction displays a ring-like structure (front, dashed circle) containing a ∼30-Å-wide channel (channel 1) that is closed by a lid density at the bottom (lid). A 90° rotation around y unveiled a connection between the major ring-like density and the lid, forming a U-like feature with a second channel (channel 2, dashed circle). The view from the back reveals four different domains (marked by stars). (C) FSC plot for the estimation of the resolution obtained from FSC curves between two half-reconstructions. For obtaining the FSC curve, selected particles were divided into two and two resulting reconstructions were individually calculated following the method suggested by Scheres et al. (54).