
Figure 4.
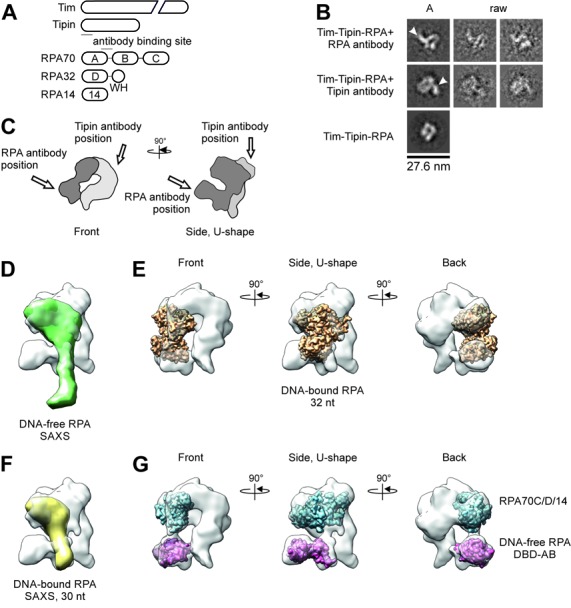
Antibody labeling of Tim-Tipin-RPA using negative stain EM and docking analysis. (A) Scheme of Tim-Tipin-RPA domain organization together with the antibody binding site within RPA70 and Tipin (solid line). (B) Different views of Tim-Tipin-RPA with an antibody against the RPA70 subunit (first row), against the N-terminus of Tipin (second row) and Tim-Tipin-RPA without antibody (third row). The RPA antibody binds sideward (marked by an arrowhead) to the ring-like density, the Tipin antibody binds on top right of the ring-like density (arrowhead). A, representative 2D class averages. raw, representative raw images. (C) Schematic representation of Tim-Tipin-RPA in two different views showing the putative localization of RPA within the model corresponding to a volume of ∼96 kDa. The putative RPA density is represented as dark gray area. The localization of the Tipin and RPA antibody is marked by an arrow. (D)–(G) Docking analysis of RPA models into the Tim-Tipin-RPA 3D reconstruction shown as transparent surface representation. RPA models: (D) SAXS model of DNA-free RPA (BioIsis ID RPADCP). (E) Crystal structure of RPA bound to 32 nt ssDNA (PDB 4GNX). (F) SAXS model of 30 nt DNA-bound RPA (BioIsis DBC30Y). (G) Crystal structure of the RPA trimerization core (blue, PDB 1L1O) and crystal structure of DNA-free RPA DBD-A and -B (magenta, PDB 1FGU chain A). In (E) and (G) three different views are shown related by 90° rotation as indicated.