
Figure 5.
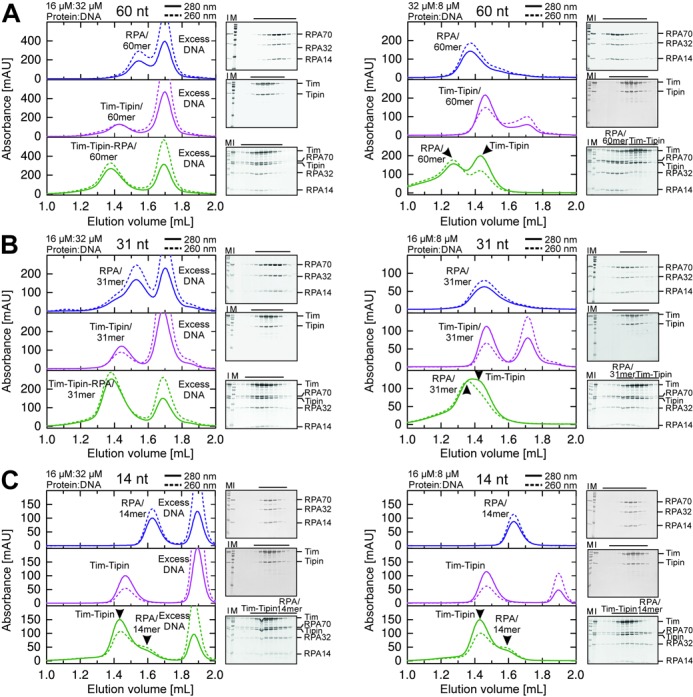
SEC analysis of RPA, Tim-Tipin and Tim-Tipin-RPA binding to ssDNA substrates. Size exclusion chromatograms of RPA (blue), Tim-Tipin (magenta) and Tim-Tipin-RPA (green) with 60 nt (A), 31 nt (B) and 14 nt (C) ssDNA and SDS-gels stained with Coomassie blue displaying the SEC protein peak fractions (black line). M, protein marker. I, protein mixture injected on SEC. Solid line: UV absorbance at 280 nm. Dashed line: UV absorbance at 260 nm. For 60 nt (A, left) and 31 nt (B, left) ssDNA, an excess of DNA resulted in an association of RPA, Tim-Tipin and Tim-Tipin-RPA with ssDNA. Accumulation of RPA on 60 nt (A, right) and 31 nt (B, right) ssDNA resulted in a breaking of the complex into DNA-free Tim-Tipin and DNA-bound RPA. Note that 14 nt ssDNA disassembles the Tim-Tipin-RPA complex and does not bind to Tim-Tipin regardless of experimental conditions (C).