
Figure 7.
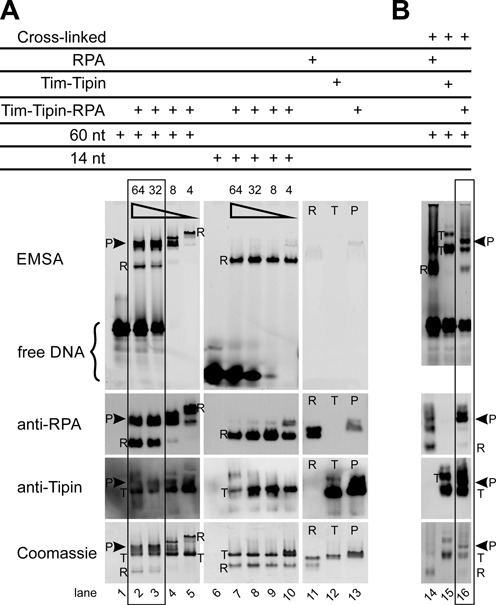
Binding of Tim-Tipin-RPA to ssDNA substrates. (A) EMSA using 60 and 14 nt 5′-FAM labeled ssDNA substrate. The protein-ssDNA complexes were visualized by fluorescence imaging (EMSA), immunoblot analysis using an anti-RPA70 and anti-Tipin primary antibody and Coomassie stain. In the presence of long excess ssDNA significant amounts of intact Tim-Tipin-RPA-ssDNA complex were detected as indicated by the left square. The presence of substoichiometric amounts of long ssDNA (lanes 4 and 5) and short ssDNA (lanes 6–10) lead to dissociation of the Tim-Tipin-RPA-ssDNA complex into DNA-free Tim-Tipin and DNA-bound RPA. The total ssDNA concentration was varied from 64, 32, 8 to 4 μM as indicated by ( ). The Tim-Tipin-RPA concentration was kept constant at 16 μM. R, RPA; T, Tim-Tipin; P, pentameric Tim-Tipin-RPA. Lanes 11–13 show the DNA-free proteins. (B) EMSA after cross-linking the complex. Double excess amounts of 60 nt 5′-FAM labeled ssDNA and RPA (3.12 μM:1.56 μM RPA), Tim-Tipin (1.84 μM:0.92 μM Tim-Tipin) and Tim-Tipin-RPA (1.2 μM:0.6 μM Tim-Tipin-RPA) are used. After incubation with the DNA substrate, the protein complexes were cross-linked with glutaraldehyde, analyzed by EMSA and visualized as in (A).