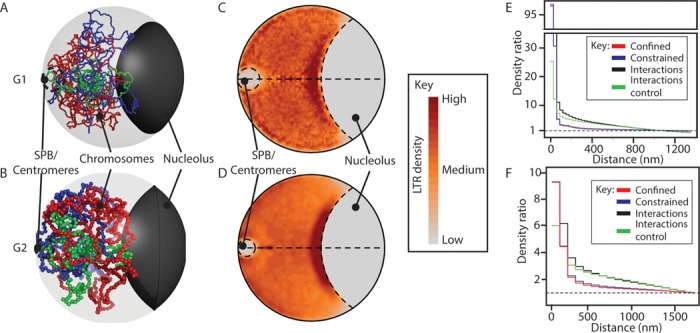
Figure 3.

Polymer models indicate LTRs colocalize close to the nucleolus. (A and B) Cartoons illustrating Schizosaccharomyces pombe genome organization during the: (A) G1; and (B) G2 phases of the cell cycle. Ensembles of coarse-grained polymer models that incorporated biological constraints and captured interactions were generated (Supplementary Methods). Representative models are shown for each cell cycle phase. SPB refers to the spindle pole body. Chromosome I, red; Chromosome II, blue; Chromosome III, green. (C and D) Two-dimensional (2D) projections of LTR density across the ensembles of polymer models show enrichment of LTRs in a nucleolar proximal region during the: (C) G1; and (D) G2 phases of the cell cycle. (E and F) Analyses of the density distribution functions (DDFs) within the: (E) G1; and (F) G2 phases of the cell cycle. Comparisons of the DDFs determined from LTR interactions in ‘constrained’ (tethering restraints only, blue line) or ‘confined’ (spatial confinement only, red line) models indicate significant colocalization (P <0.001; two-tailed, unpaired t-test, see Supplementary Methods). This colocalization is not due to a general increase in polymer compaction as colocalization of the LTR elements in the model (‘interactions’, black line) is significantly different (P < 0.001) to that for an equivalent set of random loci (‘interactions control’, green line).
