Figure 6.

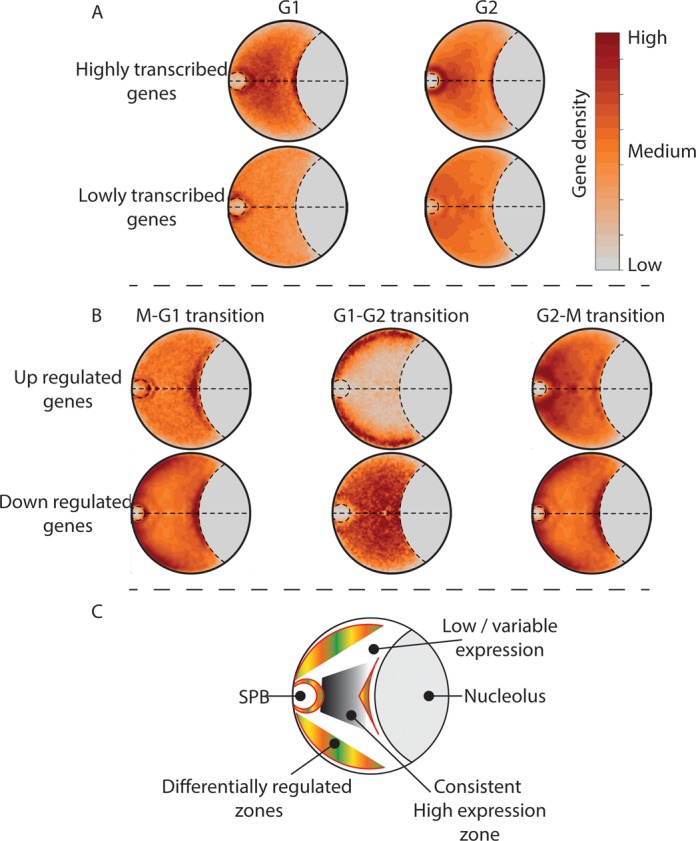
Highly transcribed and differentially regulated genes have preferred positions in Schizosaccharomyces pombe nuclei. Genes with high, low or differential transcript levels were mapped onto coarse-grained polymer models. The relative densities of the gene sets were averaged over all model ensembles and plotted as 2D gene density maps (Supplementary Methods). Here we present the gene density maps for the interactions models (see Supplementary Figure S11 for gene density maps of the confined and constrained models). The positions of genes that had differential transcript levels during the G1→G2 transition were mapped onto G1 phase polymer models (see Supplementary Figure S12 for the G1→G2 transition gene density mapped on the G2 polymer model). (A) Genes with high transcript levels occupy a central region within the S. pombe nuclei during G1 and G2. By contrast, genes with low transcript levels are dispersed throughout the nucleus. (B) Genes that are upregulated during the M→G1, G1→G2 and G2→M phase transitions occupy distinct nuclear sub-domains. (C) Cartoon highlighting the gross organization of the genes that are predominantly differentially regulated, highly and lowly expressed within the S. pombe nucleus during the G1 and G2 cell cycle phases. SPB: spindle pole body.
