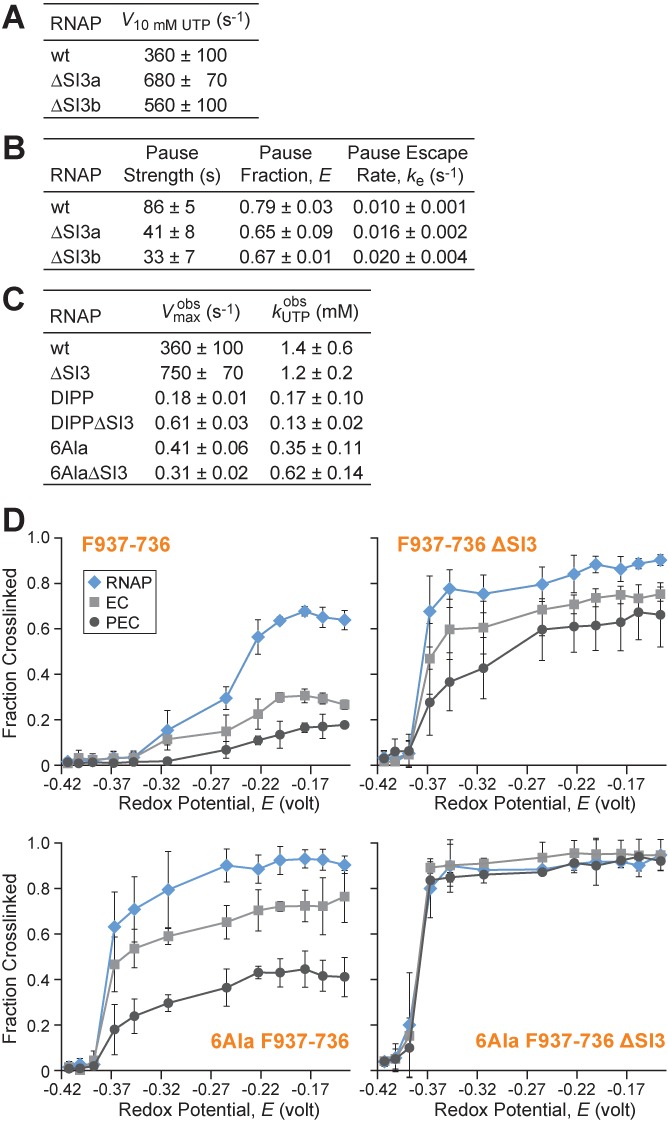
Figure 7.

SI3 effects on elongation, pausing, and CPR mapping of TL/TH conformation. (A) Single-round NTP addition rates with ScaffoldUTP (Fgure 4) for wild-type and ΔSI3 RNAPs under predicted UTP saturation levels (10 mM). ΔSI3a corresponds to Δ1043–1130 and ΔSI3b corresponds to Δ1045–1132. (B) Comparison of his pause kinetics on scaffoldPEC (as in Figure 5) for wild-type, ΔSI3a and ΔSI3b RNAPs. (C) Comparison of UTP addition kinetics (as in Figure 4) for RNAP variants ± ΔSI3. (D) F937–736 ± ΔSI3 and 6Ala F937–736 ± ΔSI3 fraction crosslinked as a function of redox potential (2.5 mM CSSC, varying DTT) in free core RNAP, EC (ScaffoldGTP) and PEC (ScaffoldPEC at pause). Data are means ± SD of experimental triplicates.
