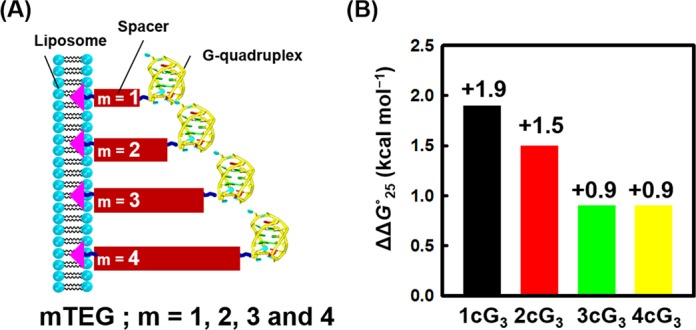
Figure 5.

(A) Schematic representation of the location of G-quadruplexes at the liposome surface as a function of spacer TEG length (Scheme 2B). (B) ΔΔG°25 in the presence of 2.0 mM POPC liposome for 1cG3 (black), 2cG3 (red), 3cG3 (green) and 4cG3 (yellow).
