
Figure 1.
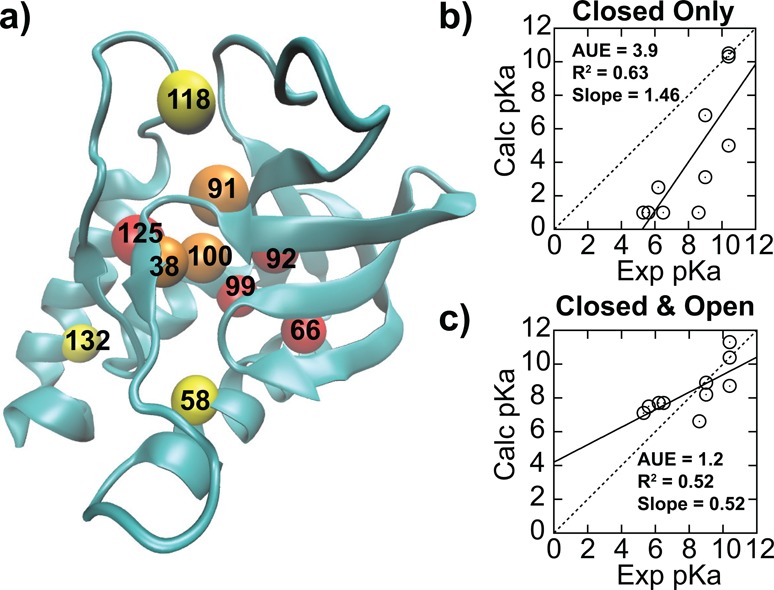
(a) Distribution of internal Lys residues of SNase mutants, color-coded depending on the pKa shift: yellow, not shifted; orange, shifted by 1–2 units; red, shifted by >2 units. Comparison between experimental and calculated pKa’s from explicit solvent pH-REX CPHMDMSλD simulations using (b) only closed crystallographic like structures and (c) both open and closed states.