Figure 7.

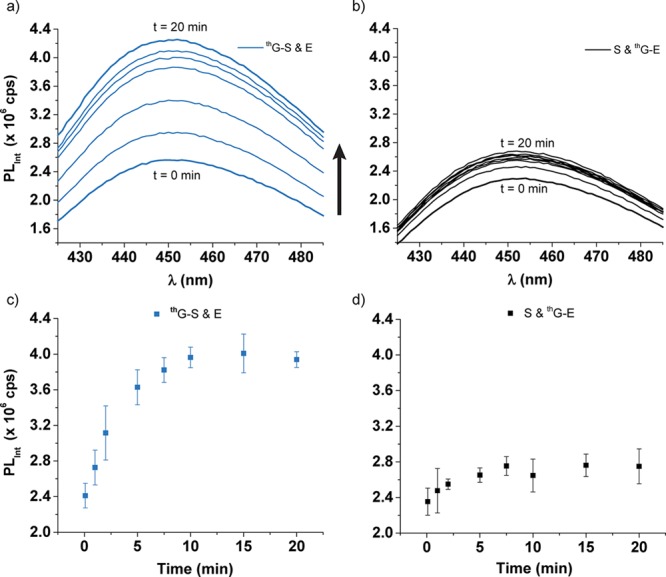
Fluorescence spectra of (a) thG-S and E (blue) (excitation 470 nm, emission 425–485 nm, slit widths 8 nm) and (b) S and thG-E (black) (excitation 470 nm, emission 425–485 nm, slit widths 4 nm), where t = 0 min and t = 20 min spectra have thicker lines. All reactions were conducted at 31 °C and contained 0.3 μM substrate, 3 μM enzyme, 50 mM Tris pH 7.0, 200 mM NaCl, and 10 mM MgCl2. The fluorescence intensity shown at 450 nm over 20 min of the (c) cleavage of thG-S by E (blue) and (d) mixing of S and thG-E (black).
