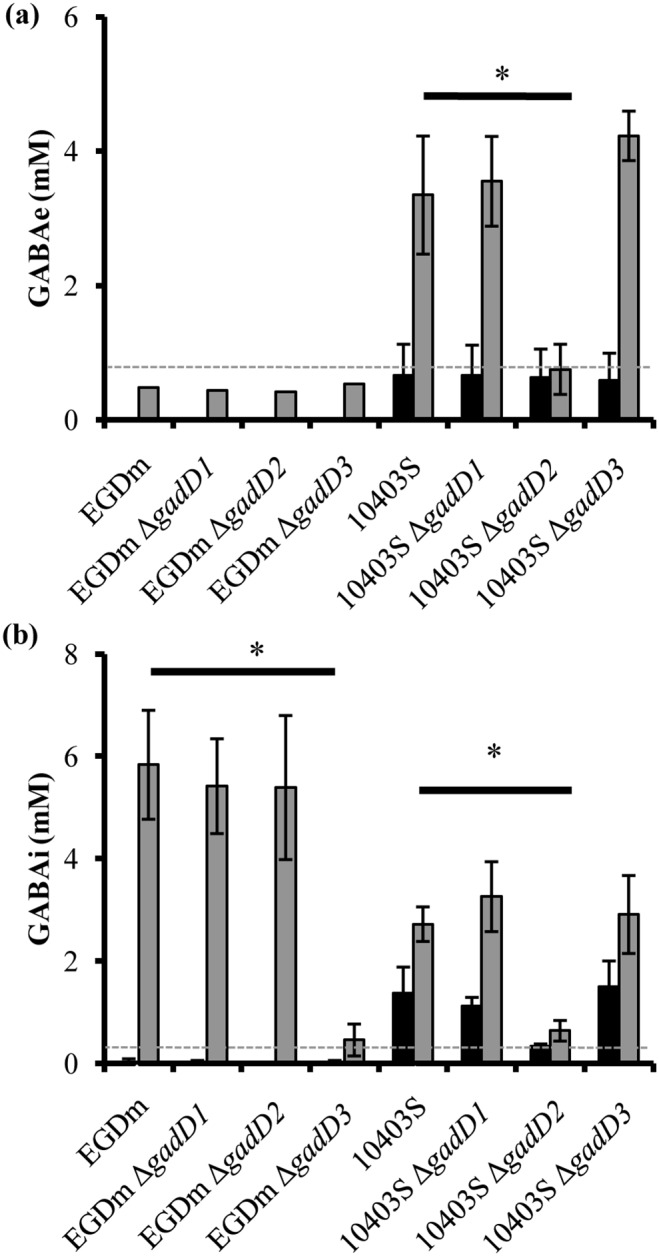
Figure 3. GABA production from L. monocytogenes gad mutants.

(a) Production of GABAe by EGDm and 10403S gad mutants with (grey) or without (black) 1 h exposure to acid at pH 4.0 (EGDm) or pH 3.5 (10403S). (B) Production of GABAi by EGDm and 10403S gadD mutants with (grey) or without (black) 1 h exposure to acid at pH 4.0 (EGDm) or pH 3.5 (10403S). Dashed horizontal lines indicate the detection limits for GABA in each experiment. Error bars represent the standard deviation from the mean of three individual biological repeats for each sample. An asterix represents signifcant difference of less than 0.05 between a given mutant and respective wild-type as determined by a student’s t-test.
