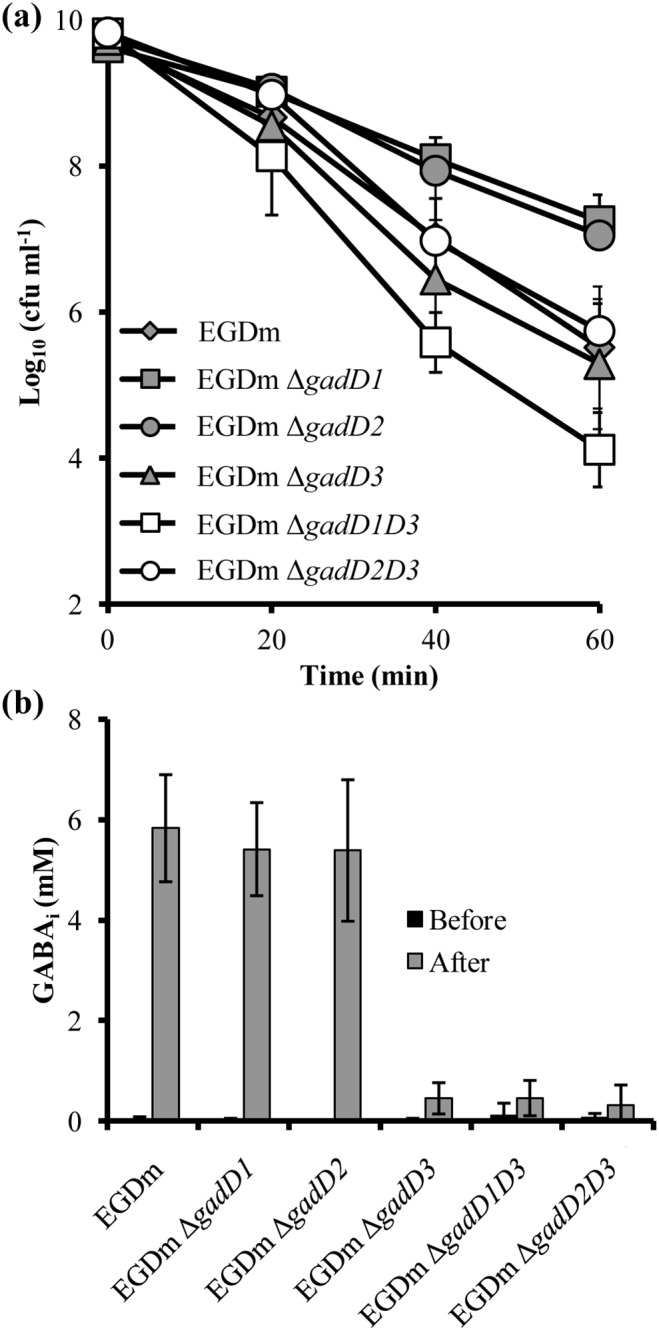
Figure 5. Acid survival and GABAi production of L. monocytogenes EGDm double GAD system mutants indicates a key role for gadD3.

(a) Stationary phase EGDm gadD mutants were acidified to pH 2.5 with 3 M HCl in BHI broth. Cell counts were taken every 20 min. Values are the means of data from three individual cultures, with the cell counts for each culture being the means of counts from three platings. Error bars represent the standard deviation from the mean value for each time-point. (b) Stationary phase EGDm gad mutants were acidified (grey) or not acidified (black) with 3 M HCl to pH 4.0 and GABAi accumulation was quantified. Error bars represent the standard deviation from the mean of three independent biological replicates.
