
Figure 3.
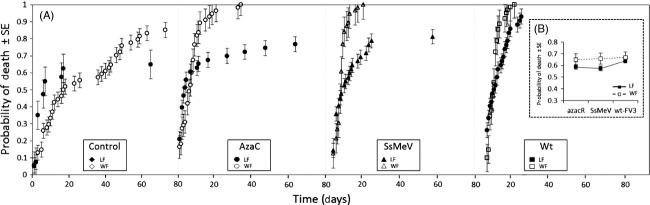
(A) Probability of death over time for leopard frog (LF) and wood frog (WF) tadpoles exposed to azaC, SsMeV and wt-FV3 illustrating strain × species interactions (n = 53 ± 7.01 on average per strain-species combination). (B) Interaction plot showing average probability of death (±SE) per strain-temperature combination. The complement of the Kaplan–Meier estimate was used to calculate the probability of death.