
Figure 1.
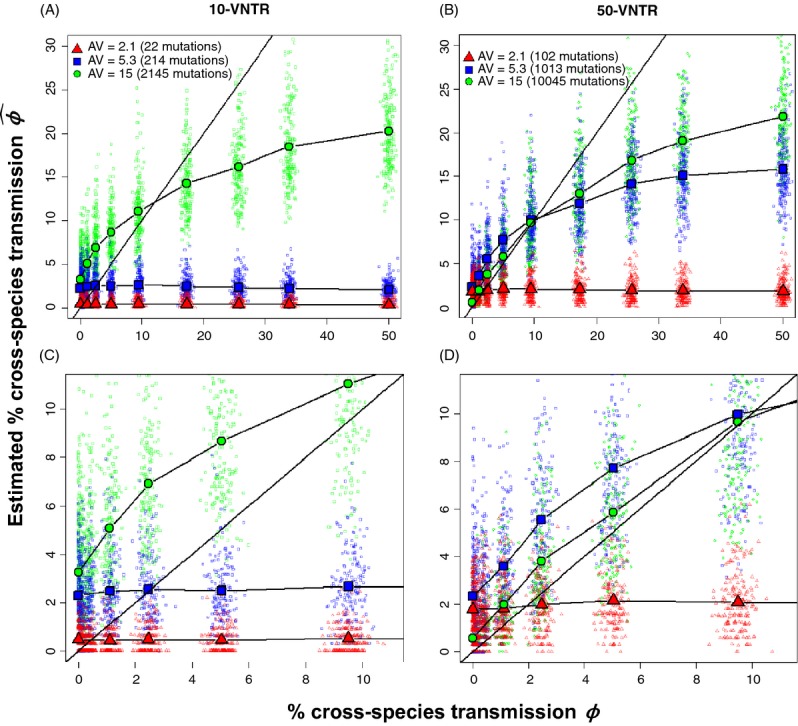
Relationship between true and estimated percentage of cross-species transmission using VNTRs when the same strain is introduced. The simulated percentage of CST, ϕ, compared with its estimation,  , using the MPR algorithm in a scenario where the strains introduced in each species were identical. Colored points represent each of the 200 simulations per value of β, whereas each line illustrates the average relationship between the realized and estimated value (points averaged over the same value of β). The straight line represents a theoretical un-biased estimation. In (A) 10 loci were used, with the average number of total mutations accumulated since introduction equal to 22, 214 and 2145. In (B) 50 loci were used, with the average number of total mutations accumulated equal to 102, 1013 and 10045. A zoomed plot of 0-10% CST is shown for (A) and B in (C) and (D), respectively.