
Figure 5.
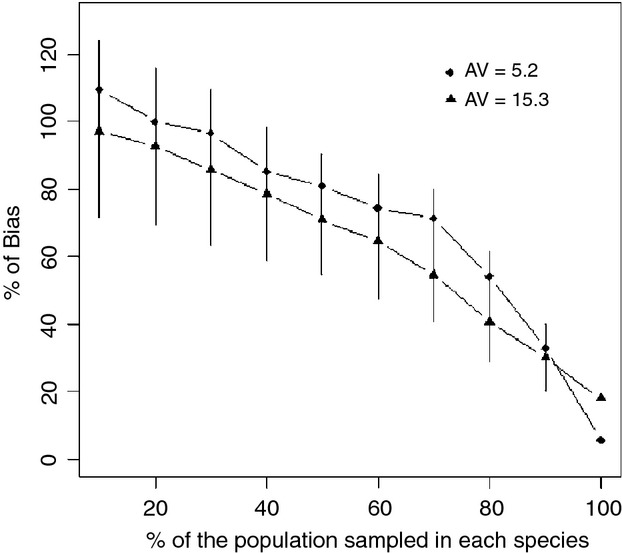
The influence of sample size on  . The percent
  in
in  decreased as the sampling percentage of the infected populations approached 100%. For this simulation, we assumed that ϕ = 10%, 50-VNTR, and an allelic variation (AV) equal to 5.2 or 15.3. Each point is an average of 400 random samplings for a given simulation and sampling intensity. Error bars represent standard errors of the mean.