
Figure 2.
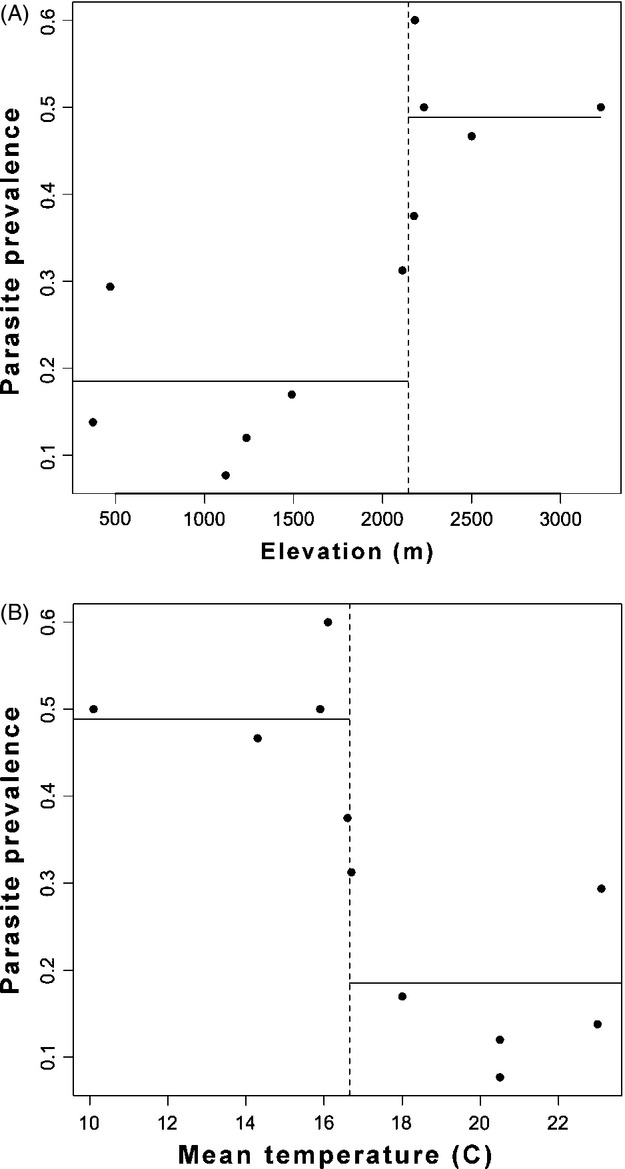
Relationship between elevation and temperature and prevalence in avian haemosporidia within the northern Andes. These two variables ranked among the most important in explaining prevalence variation under tree regression and random forest models (Fig. S2). Higher elevation sites (with lower mean annual temperatures) were found to have higher prevalences of avian haemosporidia. Vertical line represents the calculated bifurcation that best split sites according to tree regression, and horizontal lines represent prevalence means for each of those groups.