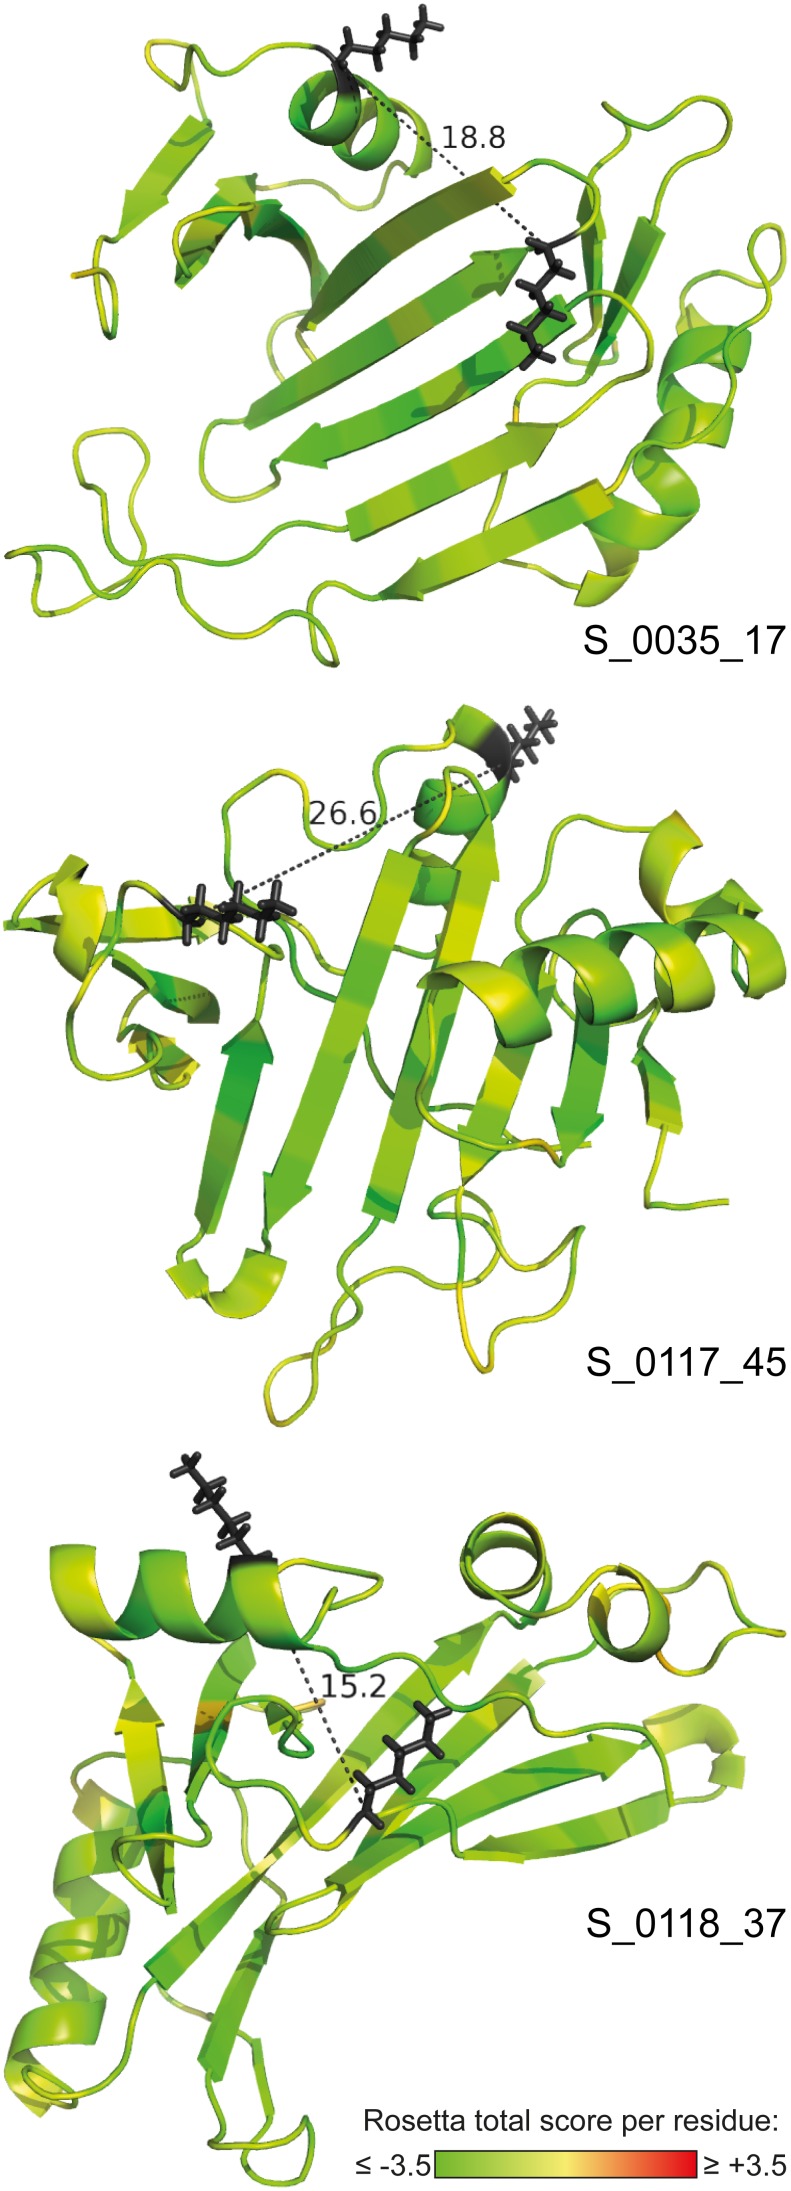
Figure 5. De novo folded models of nidogen-1 G1.
The ten best-scoring structures among the final models were all derived from four initial centroid models of the G1 domain. Structures representing three of these centroid models are shown here. These models comply with the single distance constraint in this region that was identified by cross-linking/MS. Cross-linked residues are displayed as black sticks. Cα–Cα distances are given in Å. The residues are colored according to their Rosetta total score. Scores below zero (yellow-green color) indicate energetically favorable conformations. The identifiers of the underlying centroid models are indicated.

