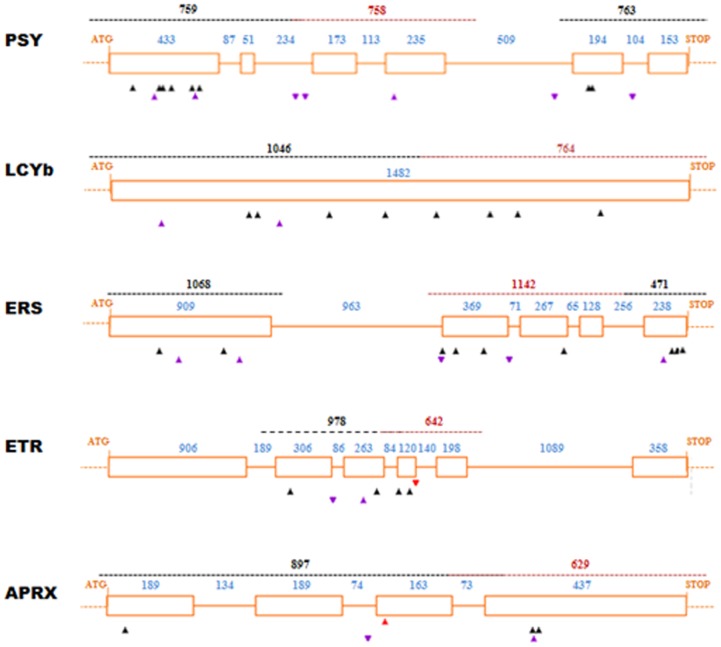
Figure 2. Gene structure of the target genes screened in the C. pepo population (PSY, LCYb, ETR1, ERS1, and APRX).
This drawing was made using the PARSESNP program, which maps the mutation on a gene model to illustrate the distribution of mutations. Orange boxes represent exons and orange lines introns, the size (pb) is indicated in blue. Dashed lines in red and black indicate amplicons analyzed by TILLING. Purple triangles represent silent mutations and black and red triangles represent missense and truncation mutations, respectively. Mutations before ATG and after STOP codon are not shown.

