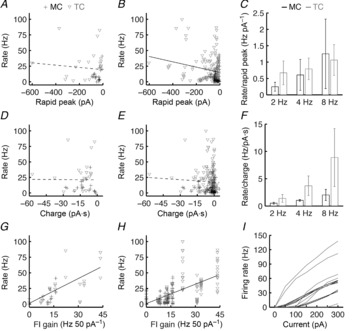
Figure 3. Differences in afferent input and excitability contribute to the higher afferent-evoked firing rates of TCs vs. MCs.

A and B, average firing rates (including subthreshold trials; e.g. see Fig.1) plotted against the average rapid peak current (e.g. see Fig.2) evoked by ONL stimulation at 2, 4 and 8 Hz for MCs (n = 6) and TCs (n = 7). The responses to the first stimulation pulse in a train of five stimulation pulses are plotted in A. The responses to all stimulation pulses are plotted in B. Rapid peak currents weakly but significantly predicted firing rates across MCs and TCs (B; black line; linear regression: P = 3.5 × 10⁻³; R2 = 0.04). This relationship proved insignificant when only considering the response to the first stimulation pulse in each train, however (A; dashed line; linear regression: P = 0.54). C, average firing rate normalized by the rapid peak current evoked by ONL stimulation at 2, 4 and 8 Hz for MCs and TCs. Error bars denote SEM. D–F, as in A–C but examining the relationship between average afferent-evoked firing rates and the total charge transferred by ONL stimulation. No significant correlation existed between rate and charge transferred in response to the first stimulation pulse (D; dashed line; linear regression: P = 0.96) or in response to the full stimulus train (E; dashed line; linear regression: P = 0.52). TCs exhibited a strong trend toward higher afferent-evoked firing rates than MCs when normalizing by the total charge transferred by afferent stimulation (F; P = 0.08, two-way ANOVA). G and H, as in A and B and D and E, but examining the relationship between average afferent-evoked firing rates and the FI curve gain measured in each MC and TC. FI curve gain significantly predicted the afferent-evoked firing rate evoked by the first ONL stimulation pulse (G; black line; linear regression: P = 1.3 × 10⁻⁴; R2 = 0.33) and the entire ONL stimulation train (H; black line; linear regression: P = 5.7 × 10⁻¹⁸; R2 = 0.32). I, FI curves of MCs and TCs measured from the response to somatic step current injections.
