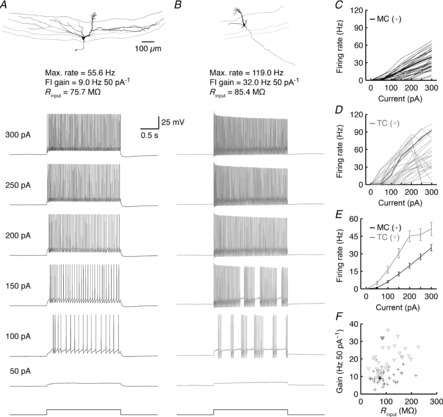
Figure 5. TCs are intrinsically more excitable than MCs.

A and B, morphology and firing response to various step current injections of a representative MC (A) and TC (B). C and D, FI relationships for 35 MCs (C) and 28 TCs (D). Thick lines correspond to representative cells shown in A and B. Note that several TCs go into depolarization block at high step current amplitudes. E, average FI relationships across all MCs and TCs. Error bars denote SEM. F, FI curve gain vs. Rinput across MCs and TCs. Thick-lined symbols correspond to representative cells.
