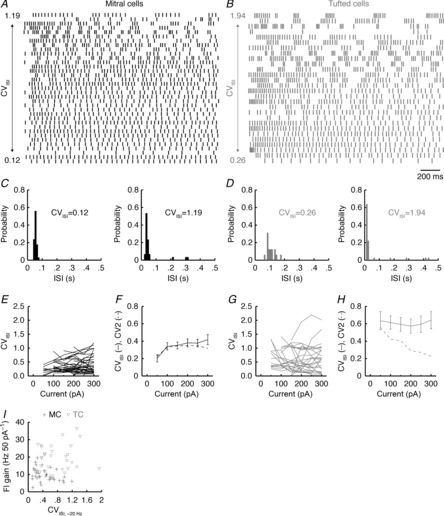
Figure 6. TCs exhibit diverse firing modes and more irregular firing than MCs.

A and B, spike raster plots across 35 MCs (A) and 28 TCs (B) for firing responses to 2 s step current injections coming closest to 20 Hz. Spike trains are ordered according to CVISI, with minimum and maximum CVISI values shown. C and D, ISI distributions of the most regular and irregular MC (C) and TC (D) spike trains shown in A and B. E, CVISI across multiple step current injection amplitudes for MCs. F, average CVISI across all MCs for multiple step current injection amplitudes. Error bars denote SEM. G and H, as in E and F for TCs. Note that TCs demonstrated a significantly higher CVISI than MCs (compare F and H; P = 5.8 × 10⁻⁹, two-way ANOVA with post hoc Tukey's test). Note also the close correspondence between the average CVISI and CV2 for MCs (F) but not for TCs (H). I, FI curve gain vs. CVISI across MCs and TCs.
