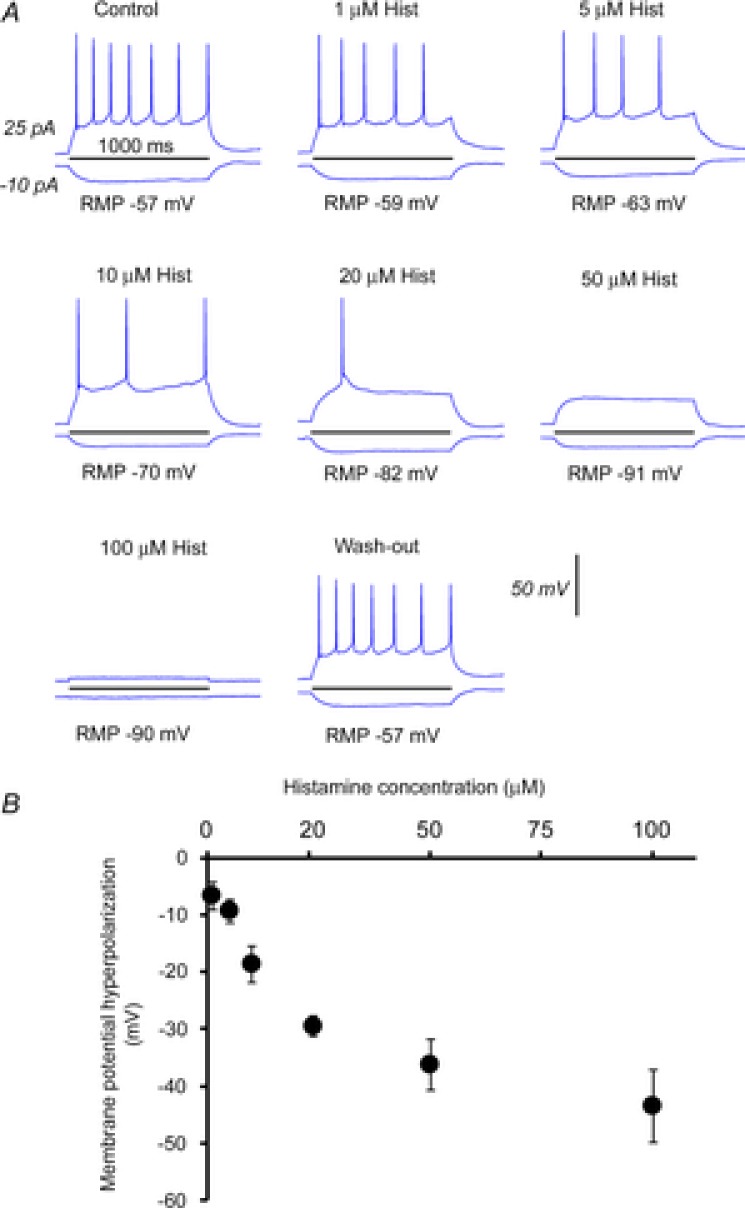
Figure 3. The dose–response effect of different histamine concentrations on MCH+ cells.

A, example current injection responses from a MCH+ cell in control, in the presence of different histamine concentrations of 1, 5, 10, 20, 50 and 100, and at washout. B, average cell membrane potential hyperpolarization (in mV) of MCH cells versus different histamine concentrations. Each data point (mean ± SEM) was calculated from test results of 4–6 cells.
