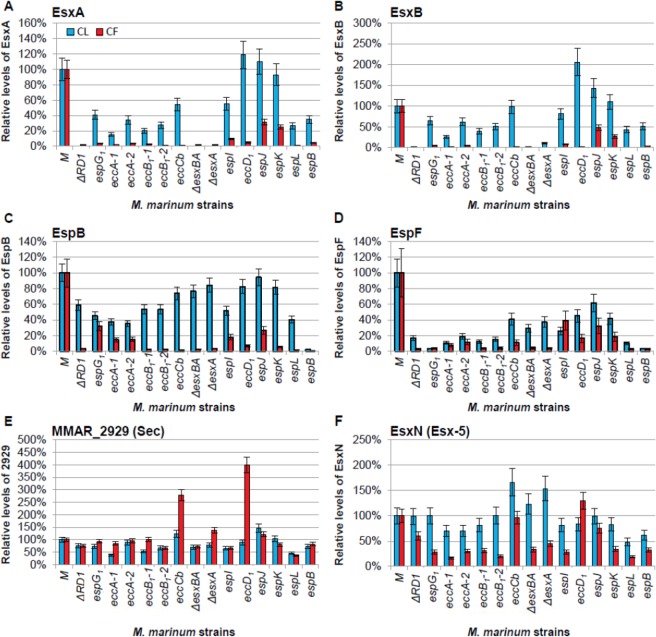
Figure 2.
Development and validation of the targeted MS Esx-1 secretion assay. (A) nLC–MRM analysis of EsxA. Relative EsxA levels within the cell lysate (CL, blue bars) or in the culture filtrate (CF, red bars) generated from Esx-1-deficient strains as compared to wild-type M. marinum. (B) nLC–MRM analysis of EsxB. For EsxA and EsxB, the ΔRD1, ΔesxA, and ΔesxBA strains served as negative controls for EsxA and EsxB detection and demonstrated the specificity of the approach. (C) nLC–MRM analysis of the levels of the EspB substrate in the CL and CF relative to the levels of EspB in the wild-type strain. For EspB, the espB::Tn strain served as a negative control for EspB detection and demonstrated the specificity of the approach. (D) nLC–MRM analysis of the levels of the EspF substrate in the CL and CF. (E) nLC–MRM analysis of MMAR_2929. (F) nLC–MRM analysis of EsxN. Error bars represent the average propagated standard error and were calculated as described in the Experimental Procedures. In all graphs changes in the levels of protein in each of the Esx-1-deficient strains as compared to the wild-type strain were considered significantly different from each other if the p value from a two-tailed Student’s t test was ≤0.05. Changes in protein levels between the wild-type and each Esx-1-deficient strain that were not statistically significant (p ≥ 0.05) were as follows: (A) The levels of EsxA in the cell lysates from the espI, eccD1, espJ, and espK strains were not statistically different from the levels in the wild-type strain. (B) The levels of EsxB in the cell lysates from the eccD1, espJ, and espK strains were not statistically different from the levels in the wild-type strain. (C) The levels of EspB in the cell lysates from the eccB1-2, eccCb, esxBA, esxA, eccD1, espK, and espL were not significantly different from the levels in the wild-type strain. (F) The levels of EsxN in the lysates from the ΔRD1, espG1, eccB1-2, espI, eccD1, espJ, espK, espL, and espB strains were not statistically different from the wild-type strain. The levels of EsxN in the culture filtrate generated from the eccCb, eccD1, and espJ strains were not statistically different from the WT strain. The actual p values are listed in the Supporting Information (Table S2). Log2 transformed versions of the CF data are available in Supplemental Figure S4.

