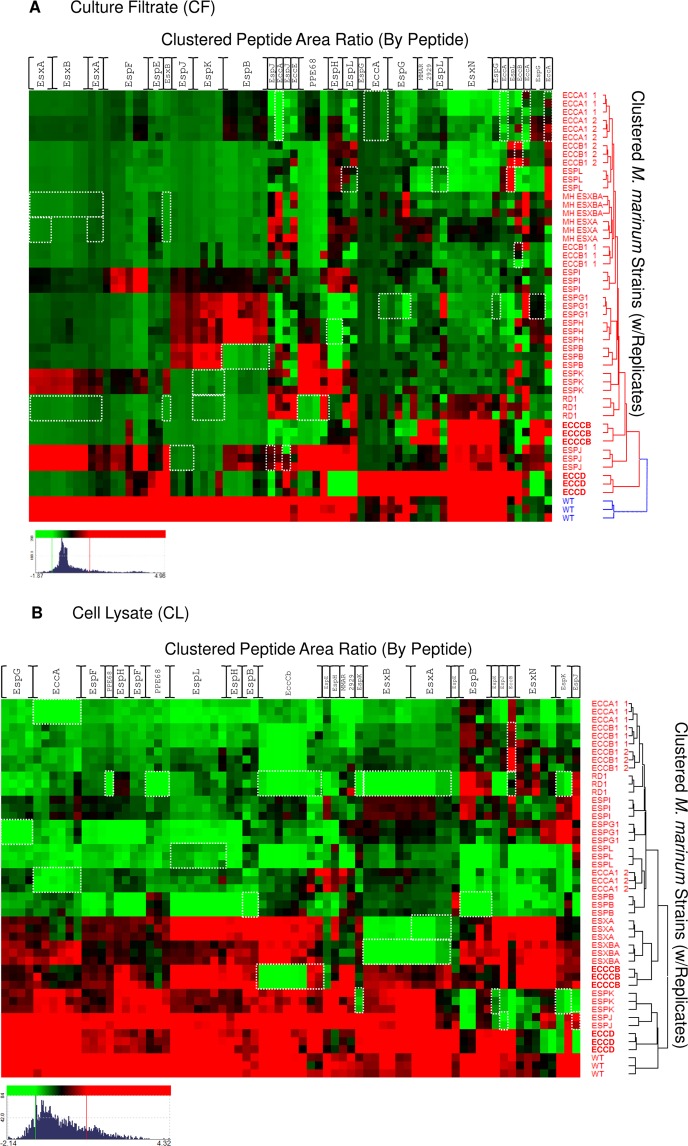
Figure 5.
Hierarchical clustering of the Esx-1-associated proteome by peptide. Hierarchical clustering was performed on the quantitative peak area response of Esx-1-derived peptides vs WT and the Esx-1-deficient M. marinum strain library. Red intensity indicates higher expression, and green indicates lower expression vs the mean value for each gene product. Clustering was independently performed on nLC–MRM data from (A) culture filtrate (CF) and (B) cell lysate (CL) peak response. Threshold was set to 1S.D for color response. Displayed dynamic range for CF (Log2 −1.87–4.96 green–red) and CL (Log2 −2.14–4.32 green–red). Novel ESX-1 substrates PPE68, EspJ, and EspK are readily apparent from examination of the CF data, and loss of substrate stability in Esx-1 mutants is also well represented in CL fractions. White boxes indicate peptides that are absent due to interruption or loss of the gene that encodes the protein. For example, in the esxA deletion strains, the peptides corresponding to EsxA are boxed in white. Columns are listed for each protein for simplicity but represent individual peptide responses as in Supplemental Figure S1.

